H-E-B DIGITAL
Enterprise Ecosystem
Background
Problem
Enterprise design teams were developing several custom tools for operational partners in isolation – forming a fragmented ecosystem of internal tools, users, and data.
Role
Design strategy
Participated in workshops and research
Synthesized findings and insights
Crafted toolsets an frameworks
Team
Enterprise design research
Objectives
Form a unified understanding of enterprise users and workflows by:
Seeing the enterprise organization as an ecosystem, shifting focus from individual tools to connected partner needs.
Mapping partner roles, responsibilities, and processes to boost design team efficiency by reducing redundant workflows and tools.
Creating frameworks for designers to help them define solutions and prioritize work, possibly expanding support to product managers and engineers.
Getting agreement and feedback from design leaders to put frameworks and processes into practice.
Research & discovery
Audit
The enterprise ecosystem project began by gathering and reviewing existing studies and frameworks that described the enterprise organization, tools, and processes we supported. The team reviewed cross-cutting research done by separate squads, reviewed existing frameworks for accuracy, examined previous jobs-to-be-done studies, and met 1:1 with design SMEs. Our goal was to begin uncovering shared experiences we could elevate beyond individual teams.
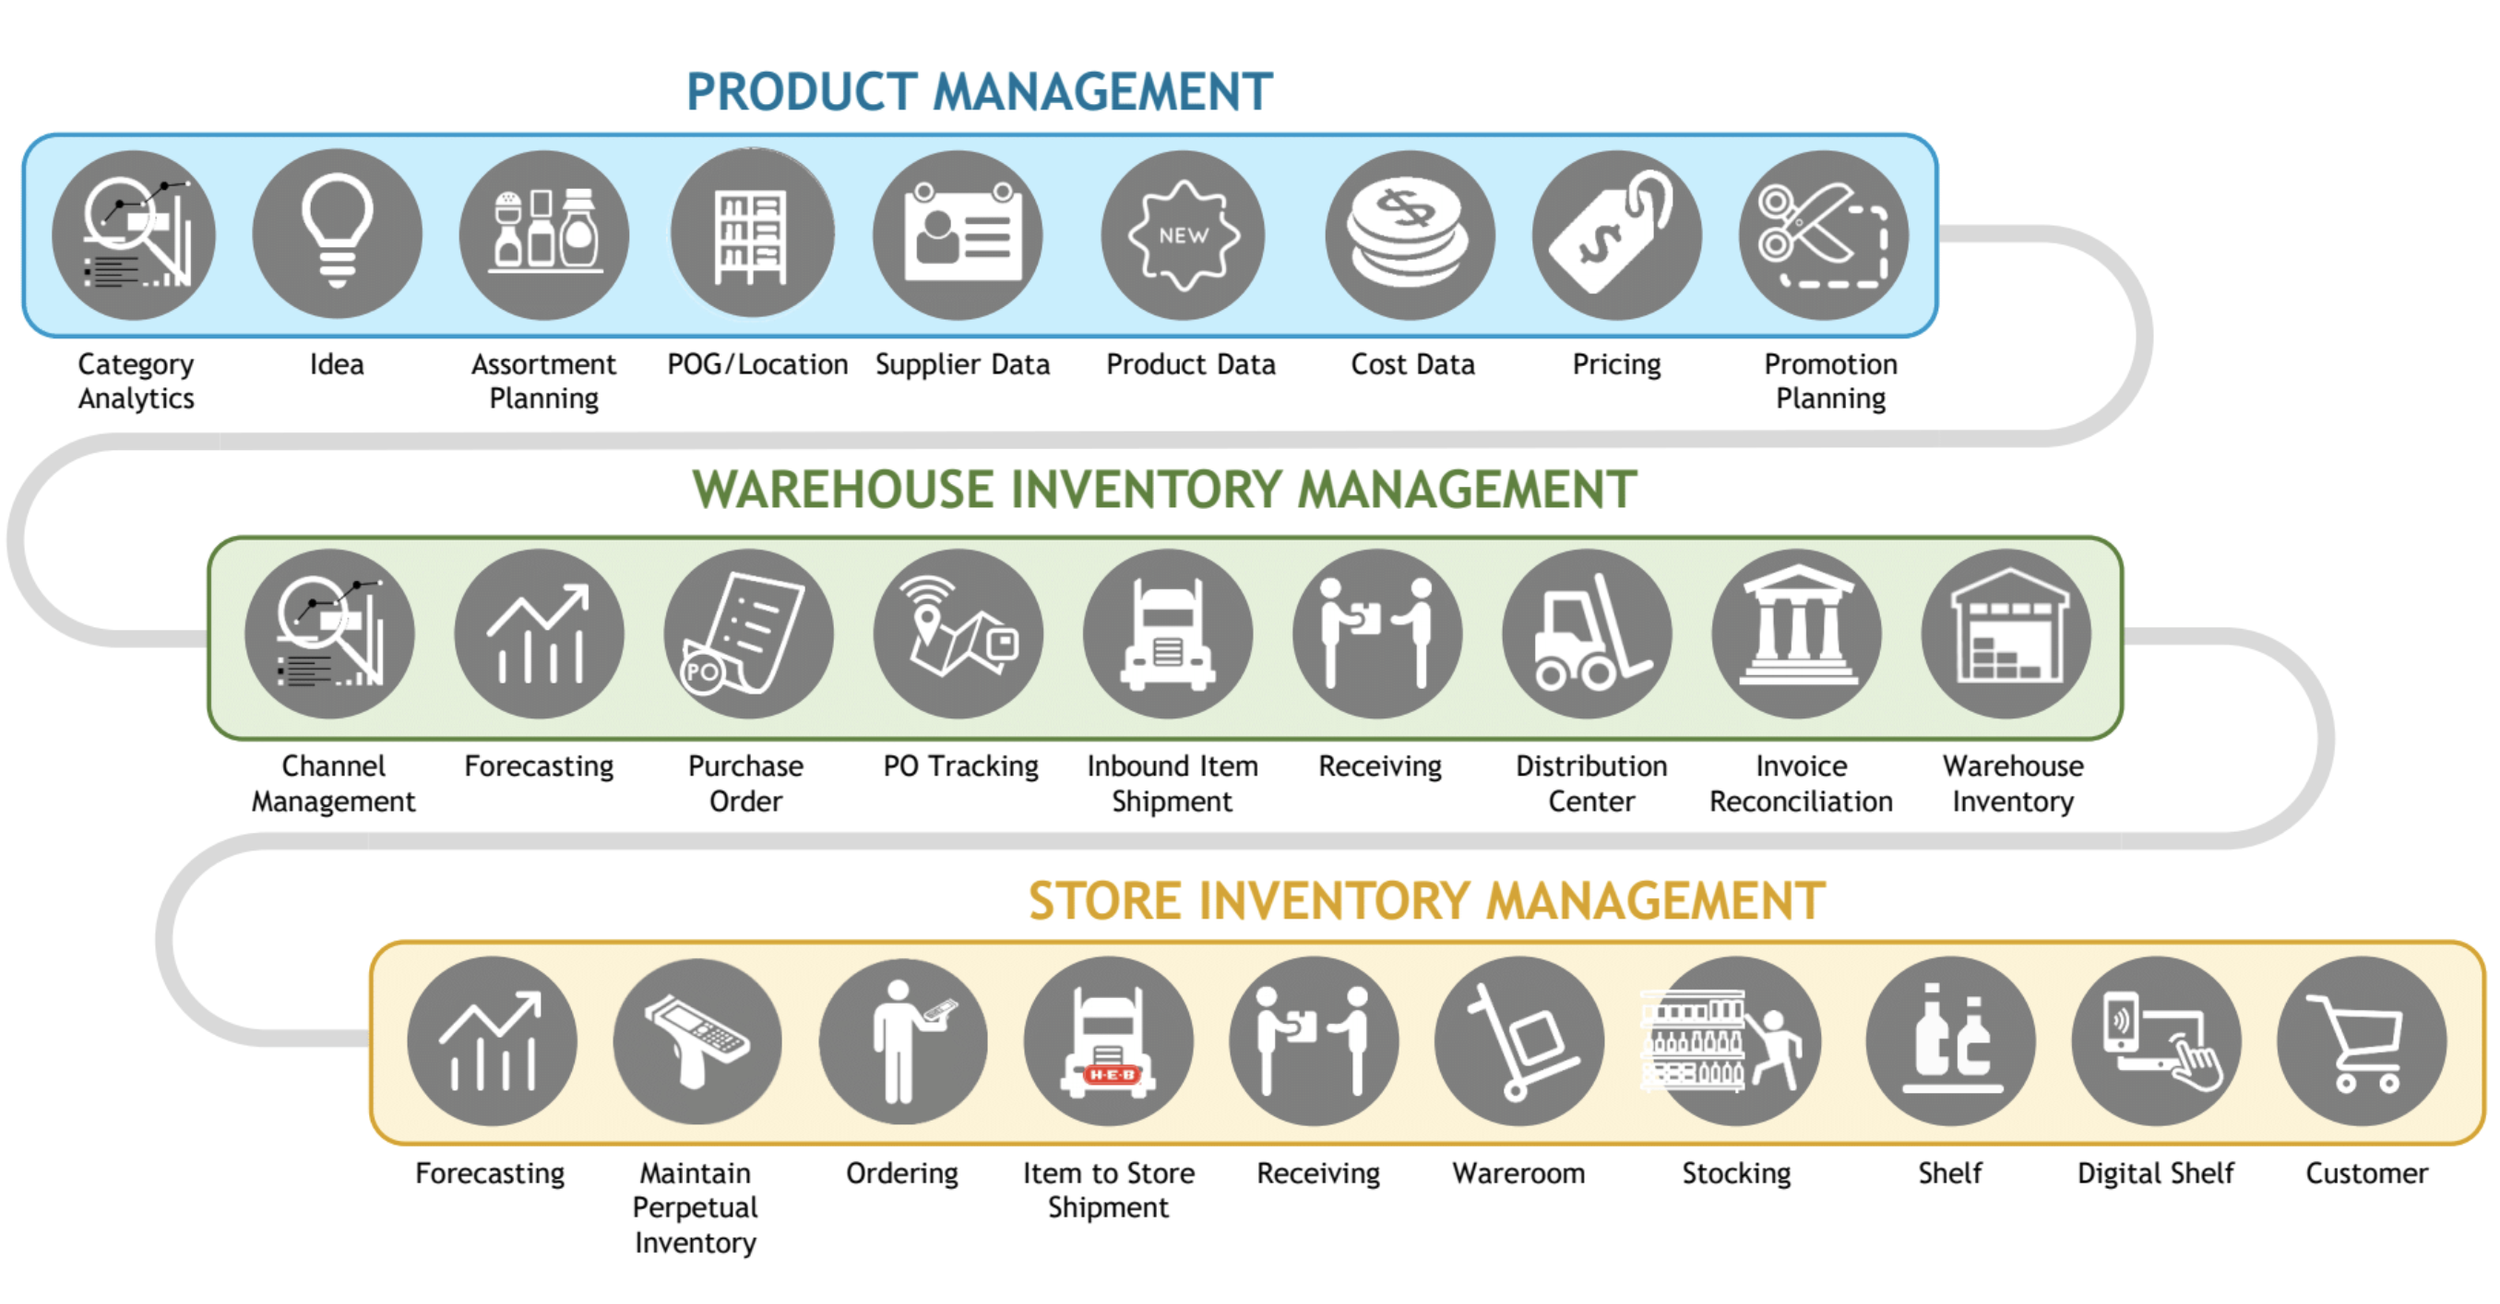
Snake diagram created by operational teams to define the inventory and supply chain process and tools used
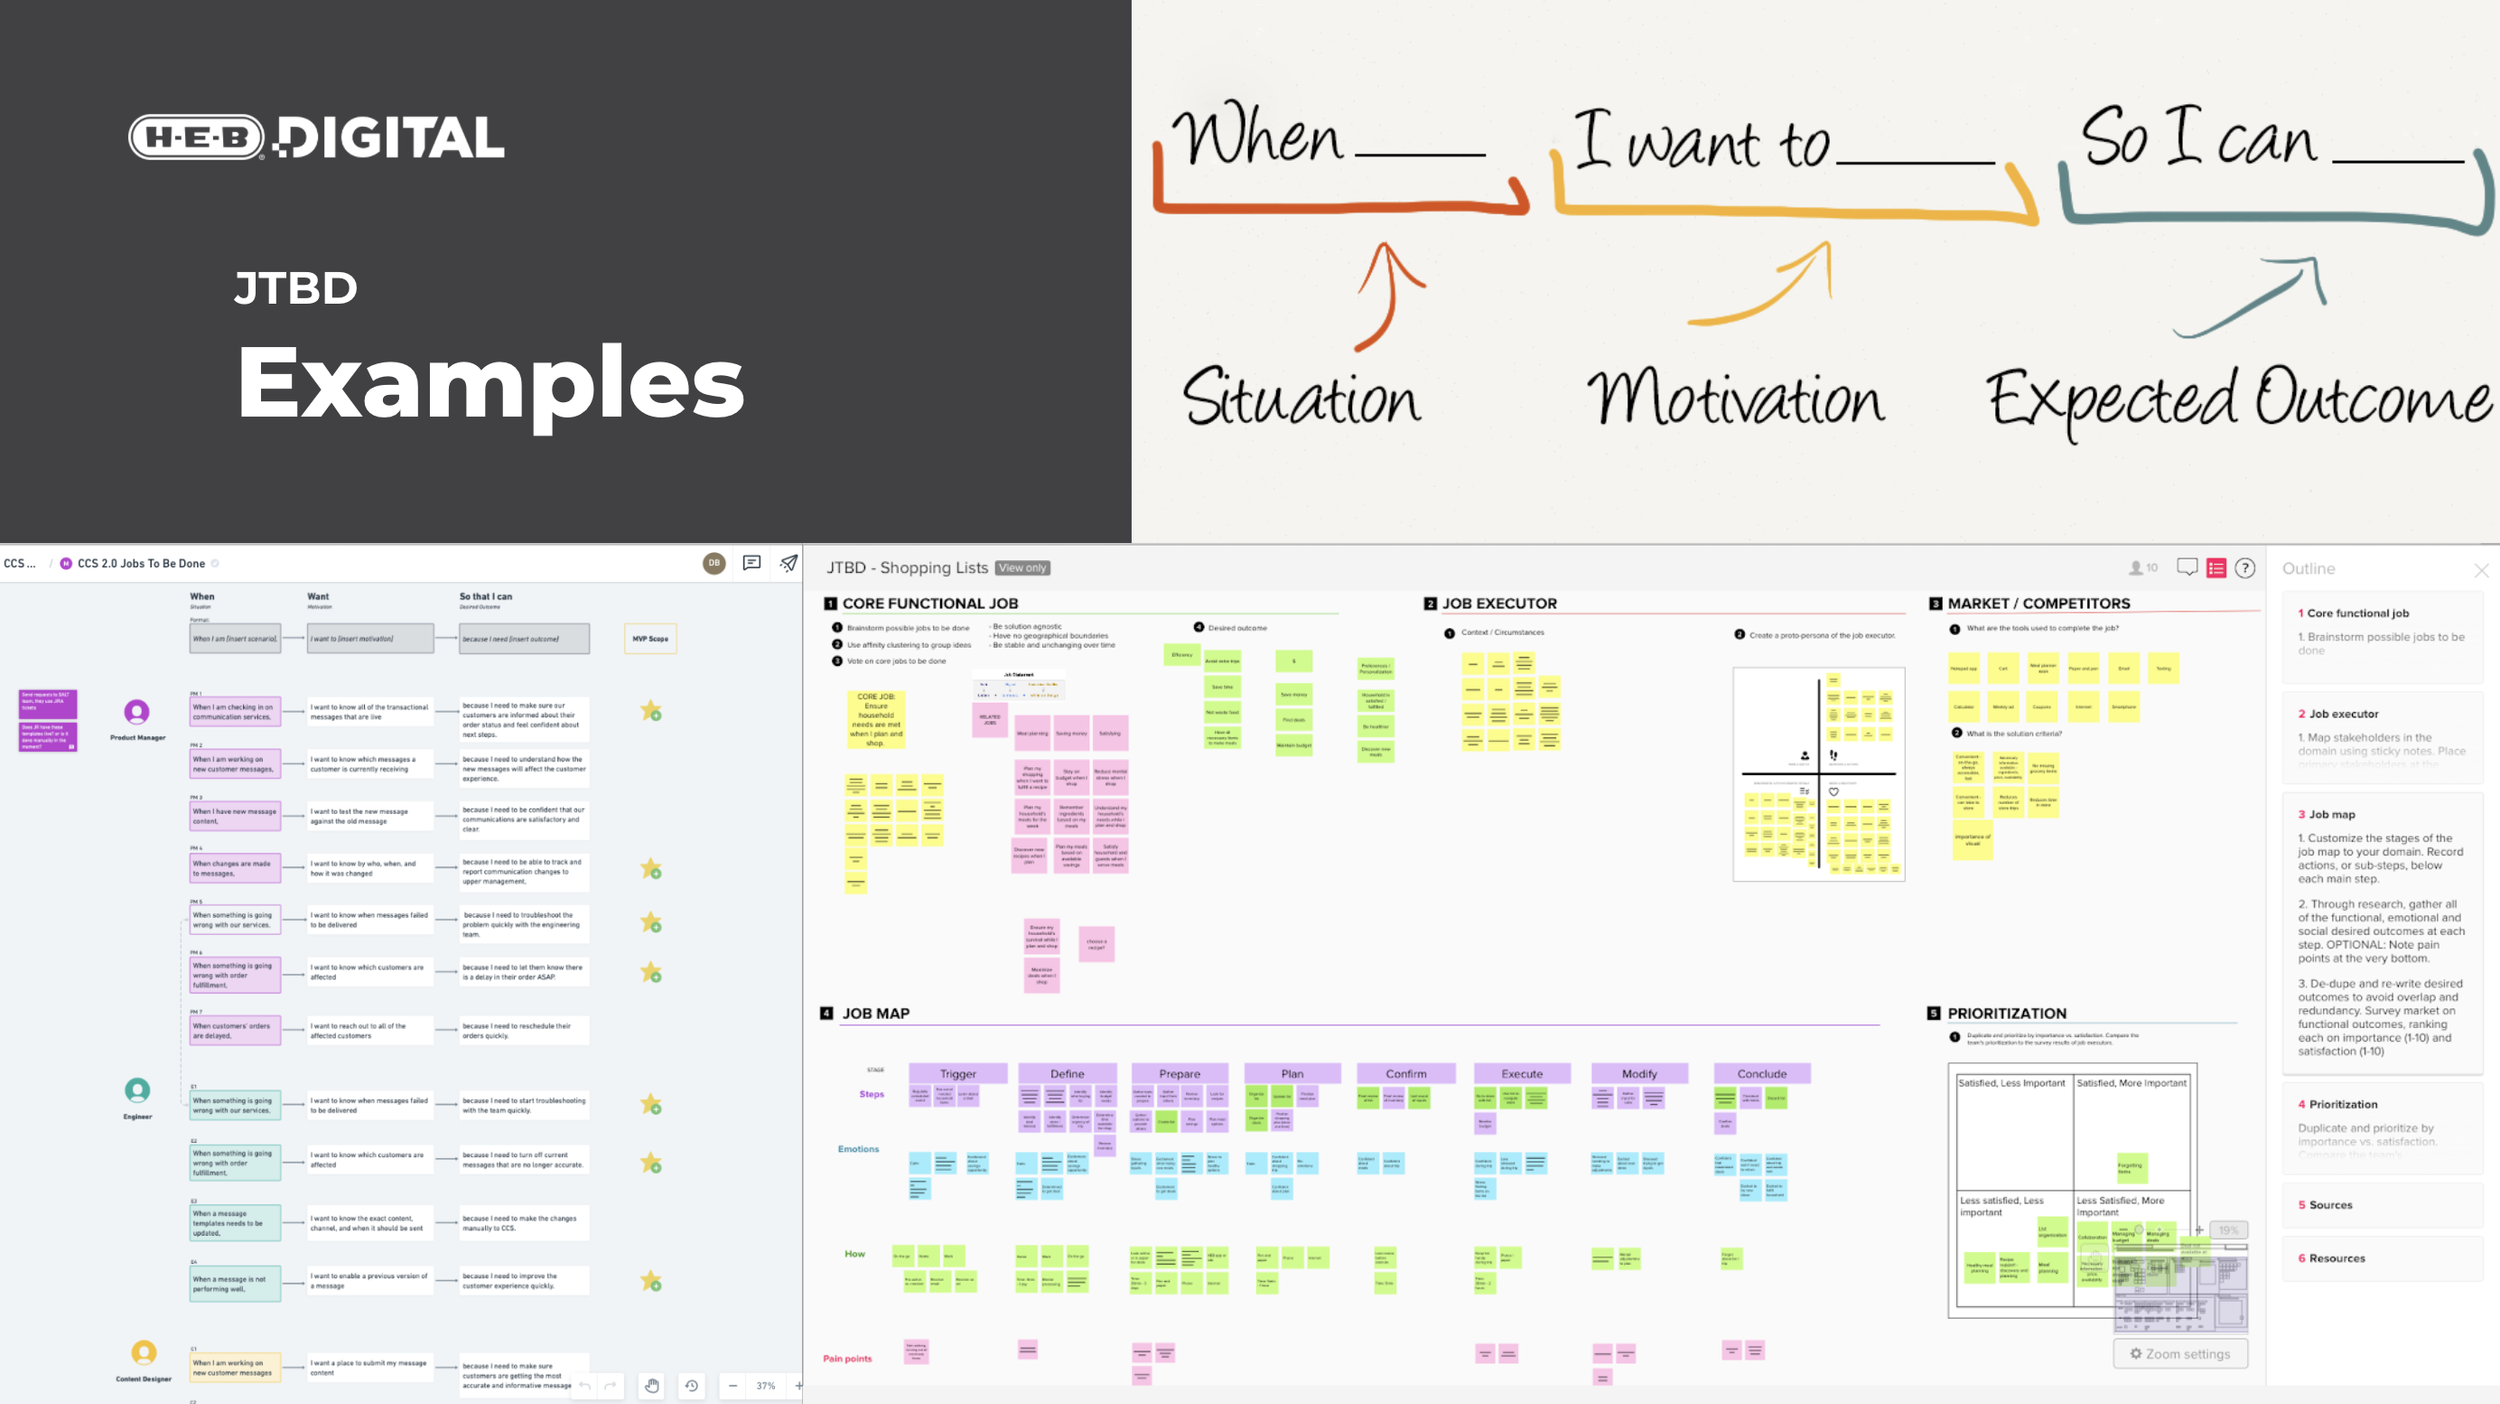
Example of JTBD efforts conducted by individual squads
Tooling workshops
We held workshops that brought together designers from different squads to get them out of their siloes to work together. During our workshops we:
Mapped task flows across tools, user roles, and outcomes.
Identified shared data objects.
Uncovered work-arounds our tools were not supporting.
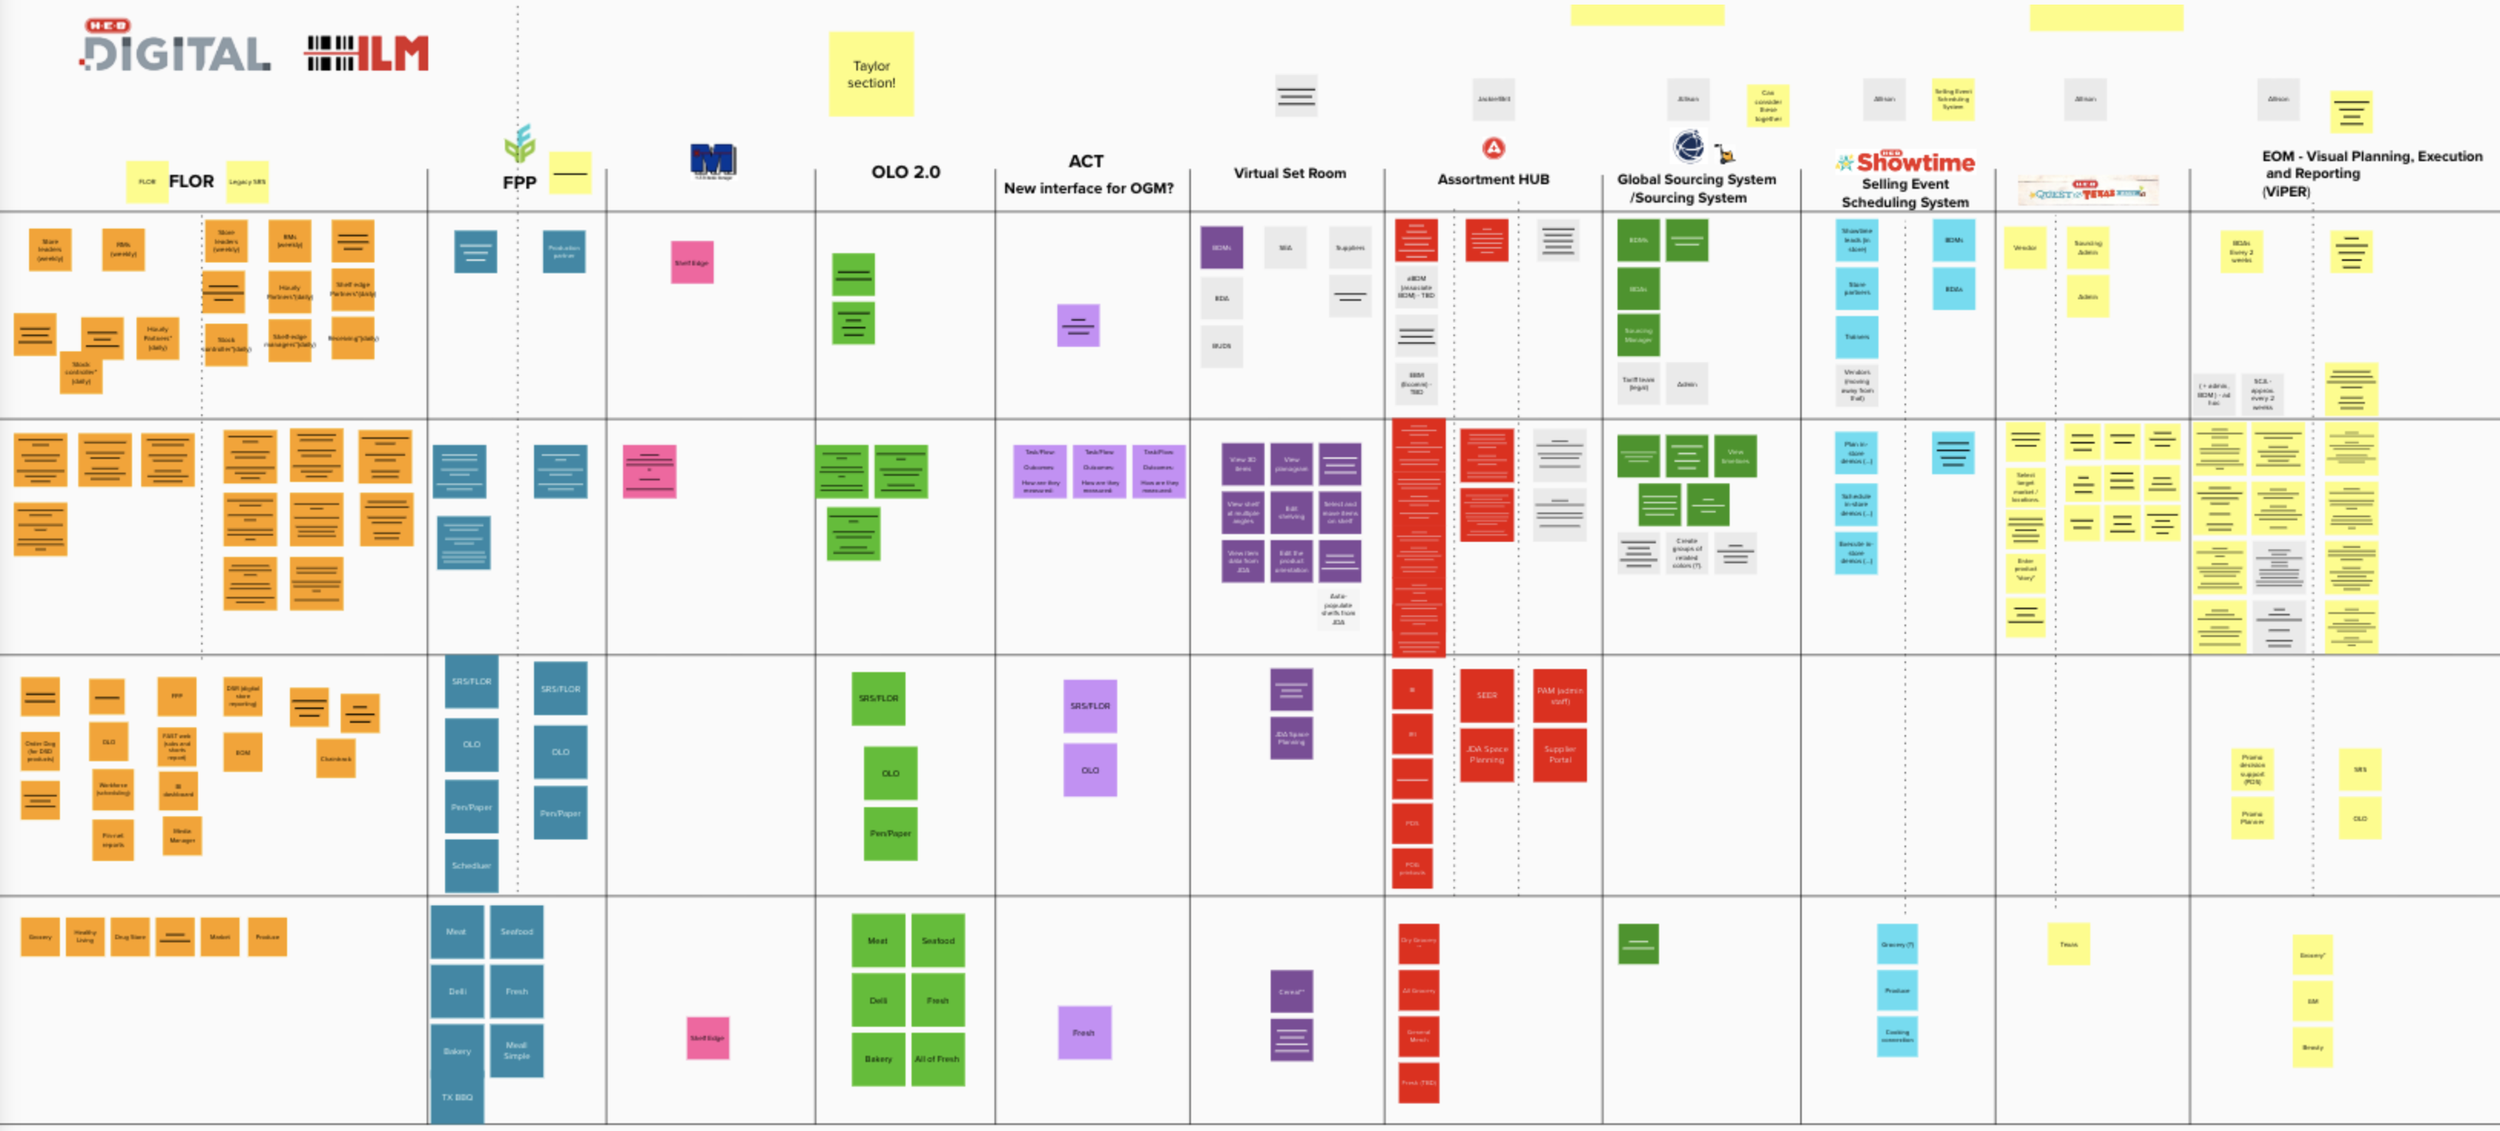
Team: Inventory & Location Management
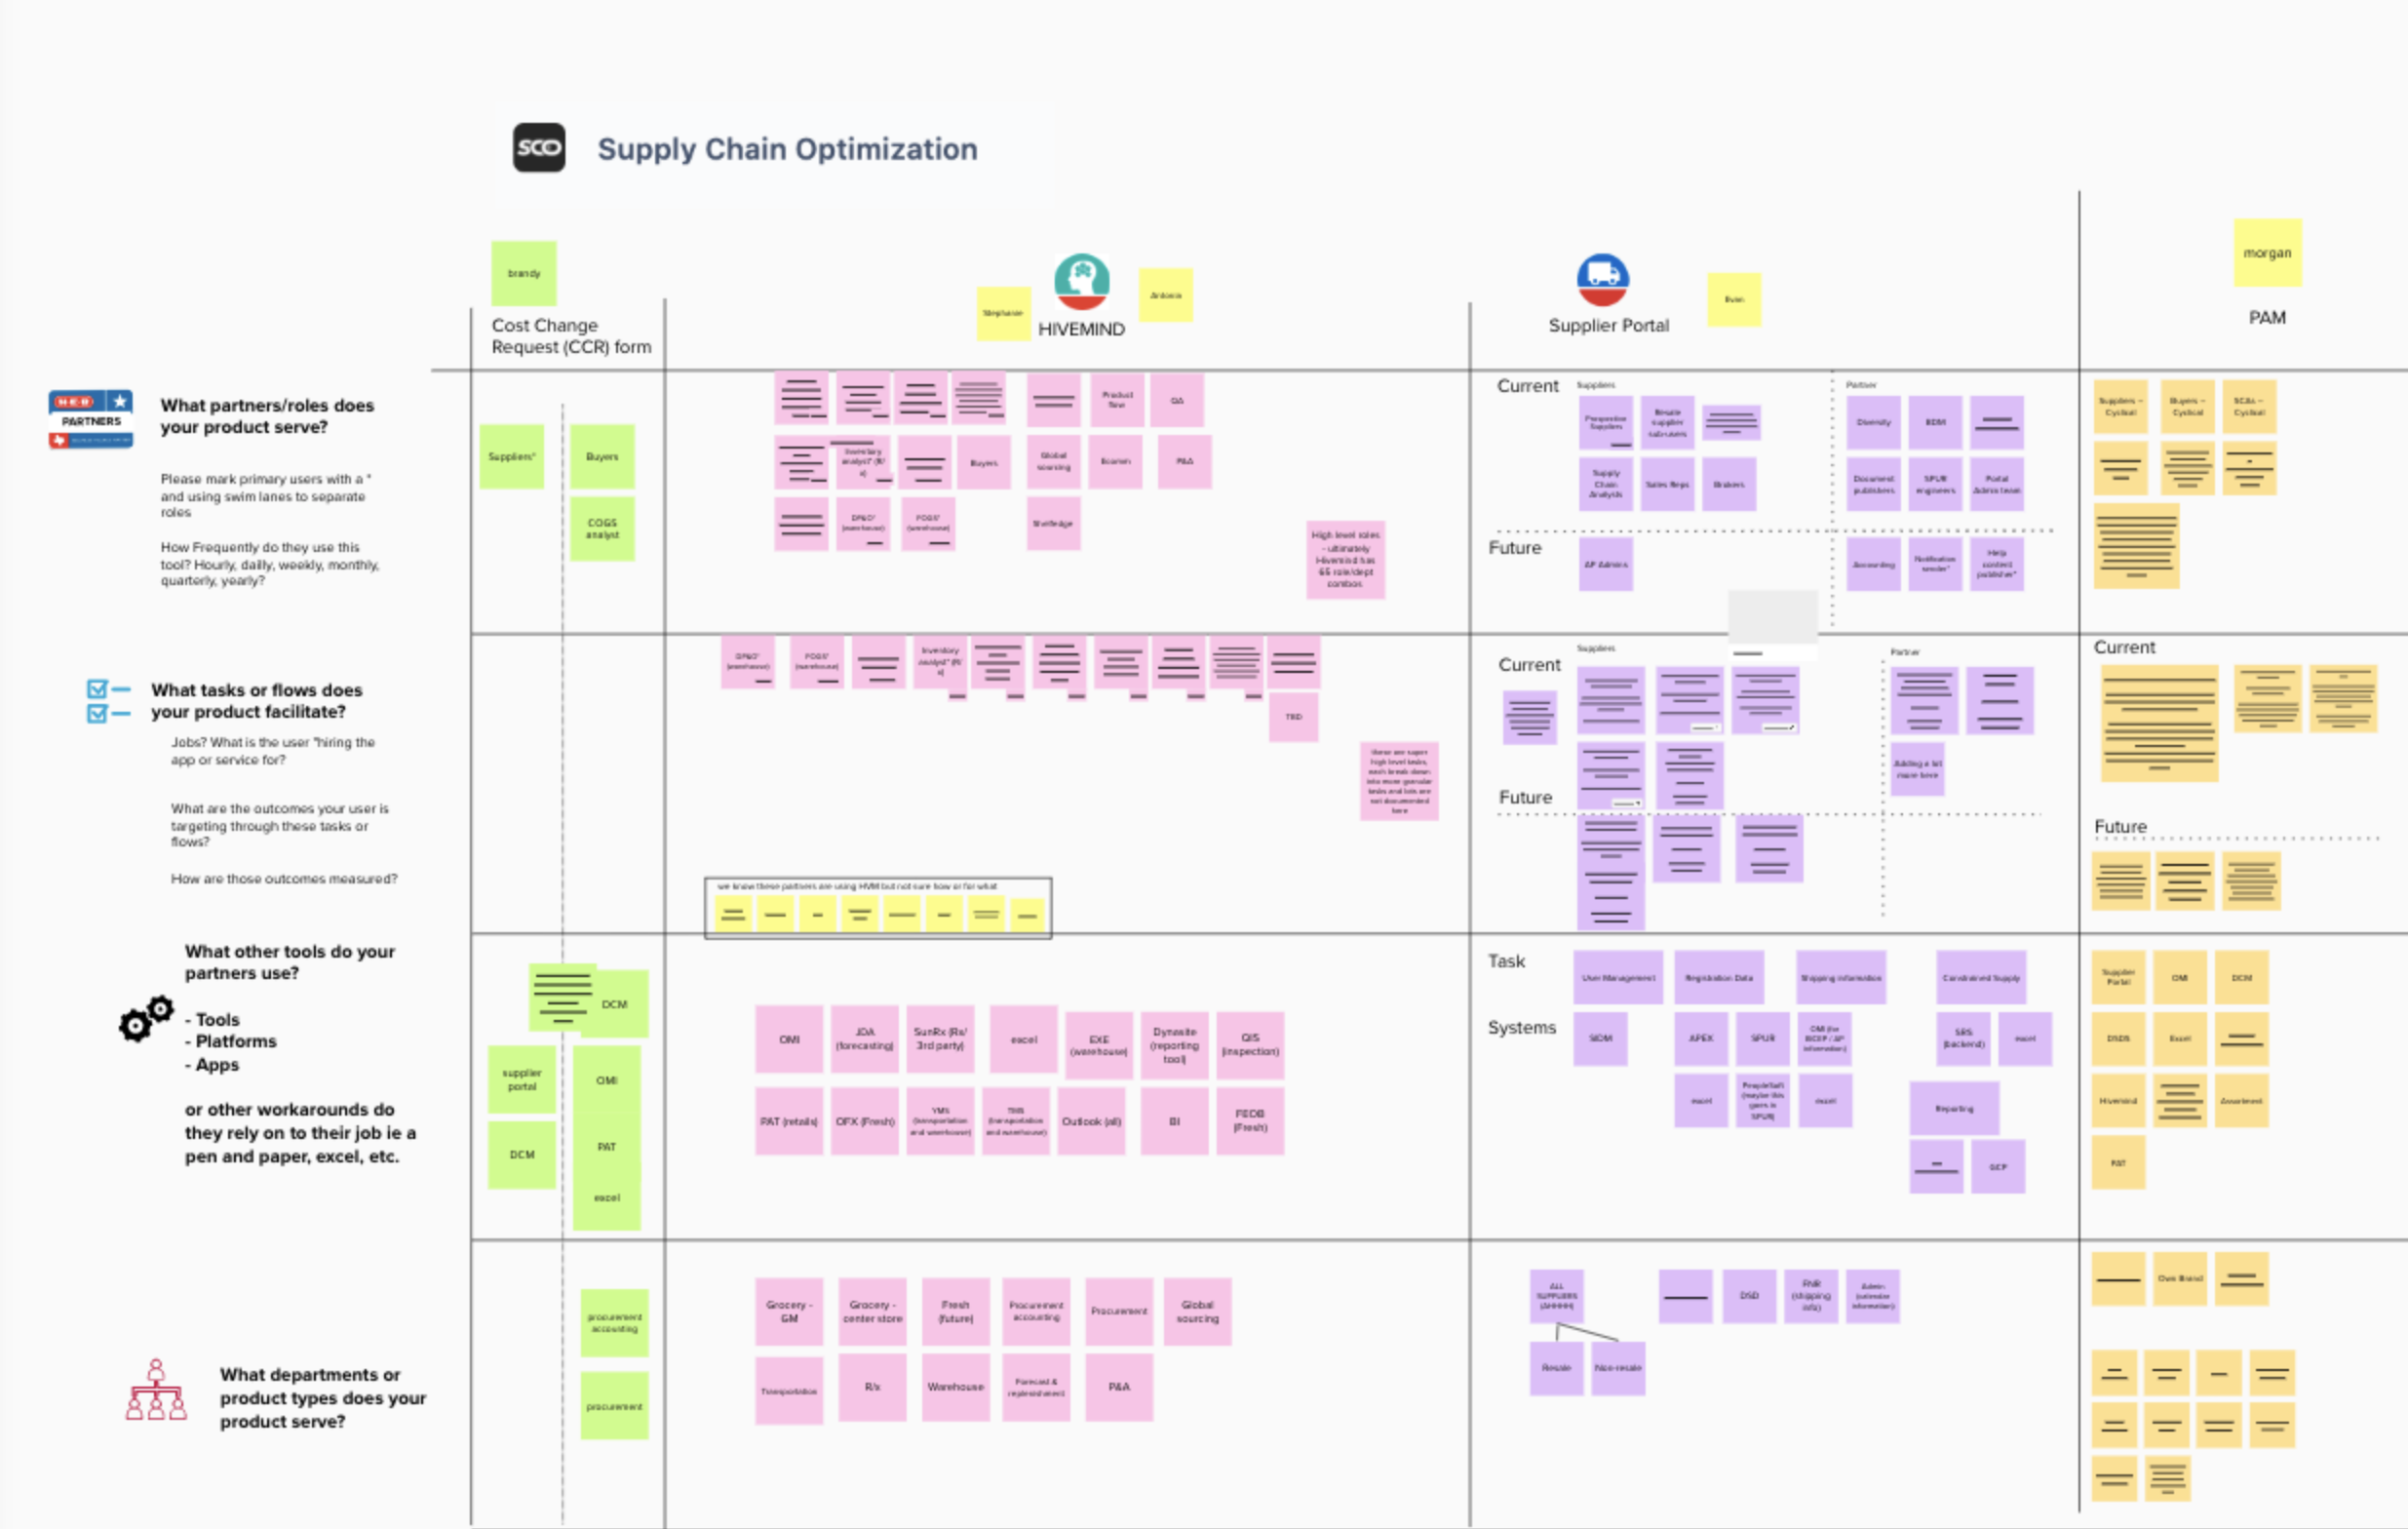
Team: Supply Chain Optimization
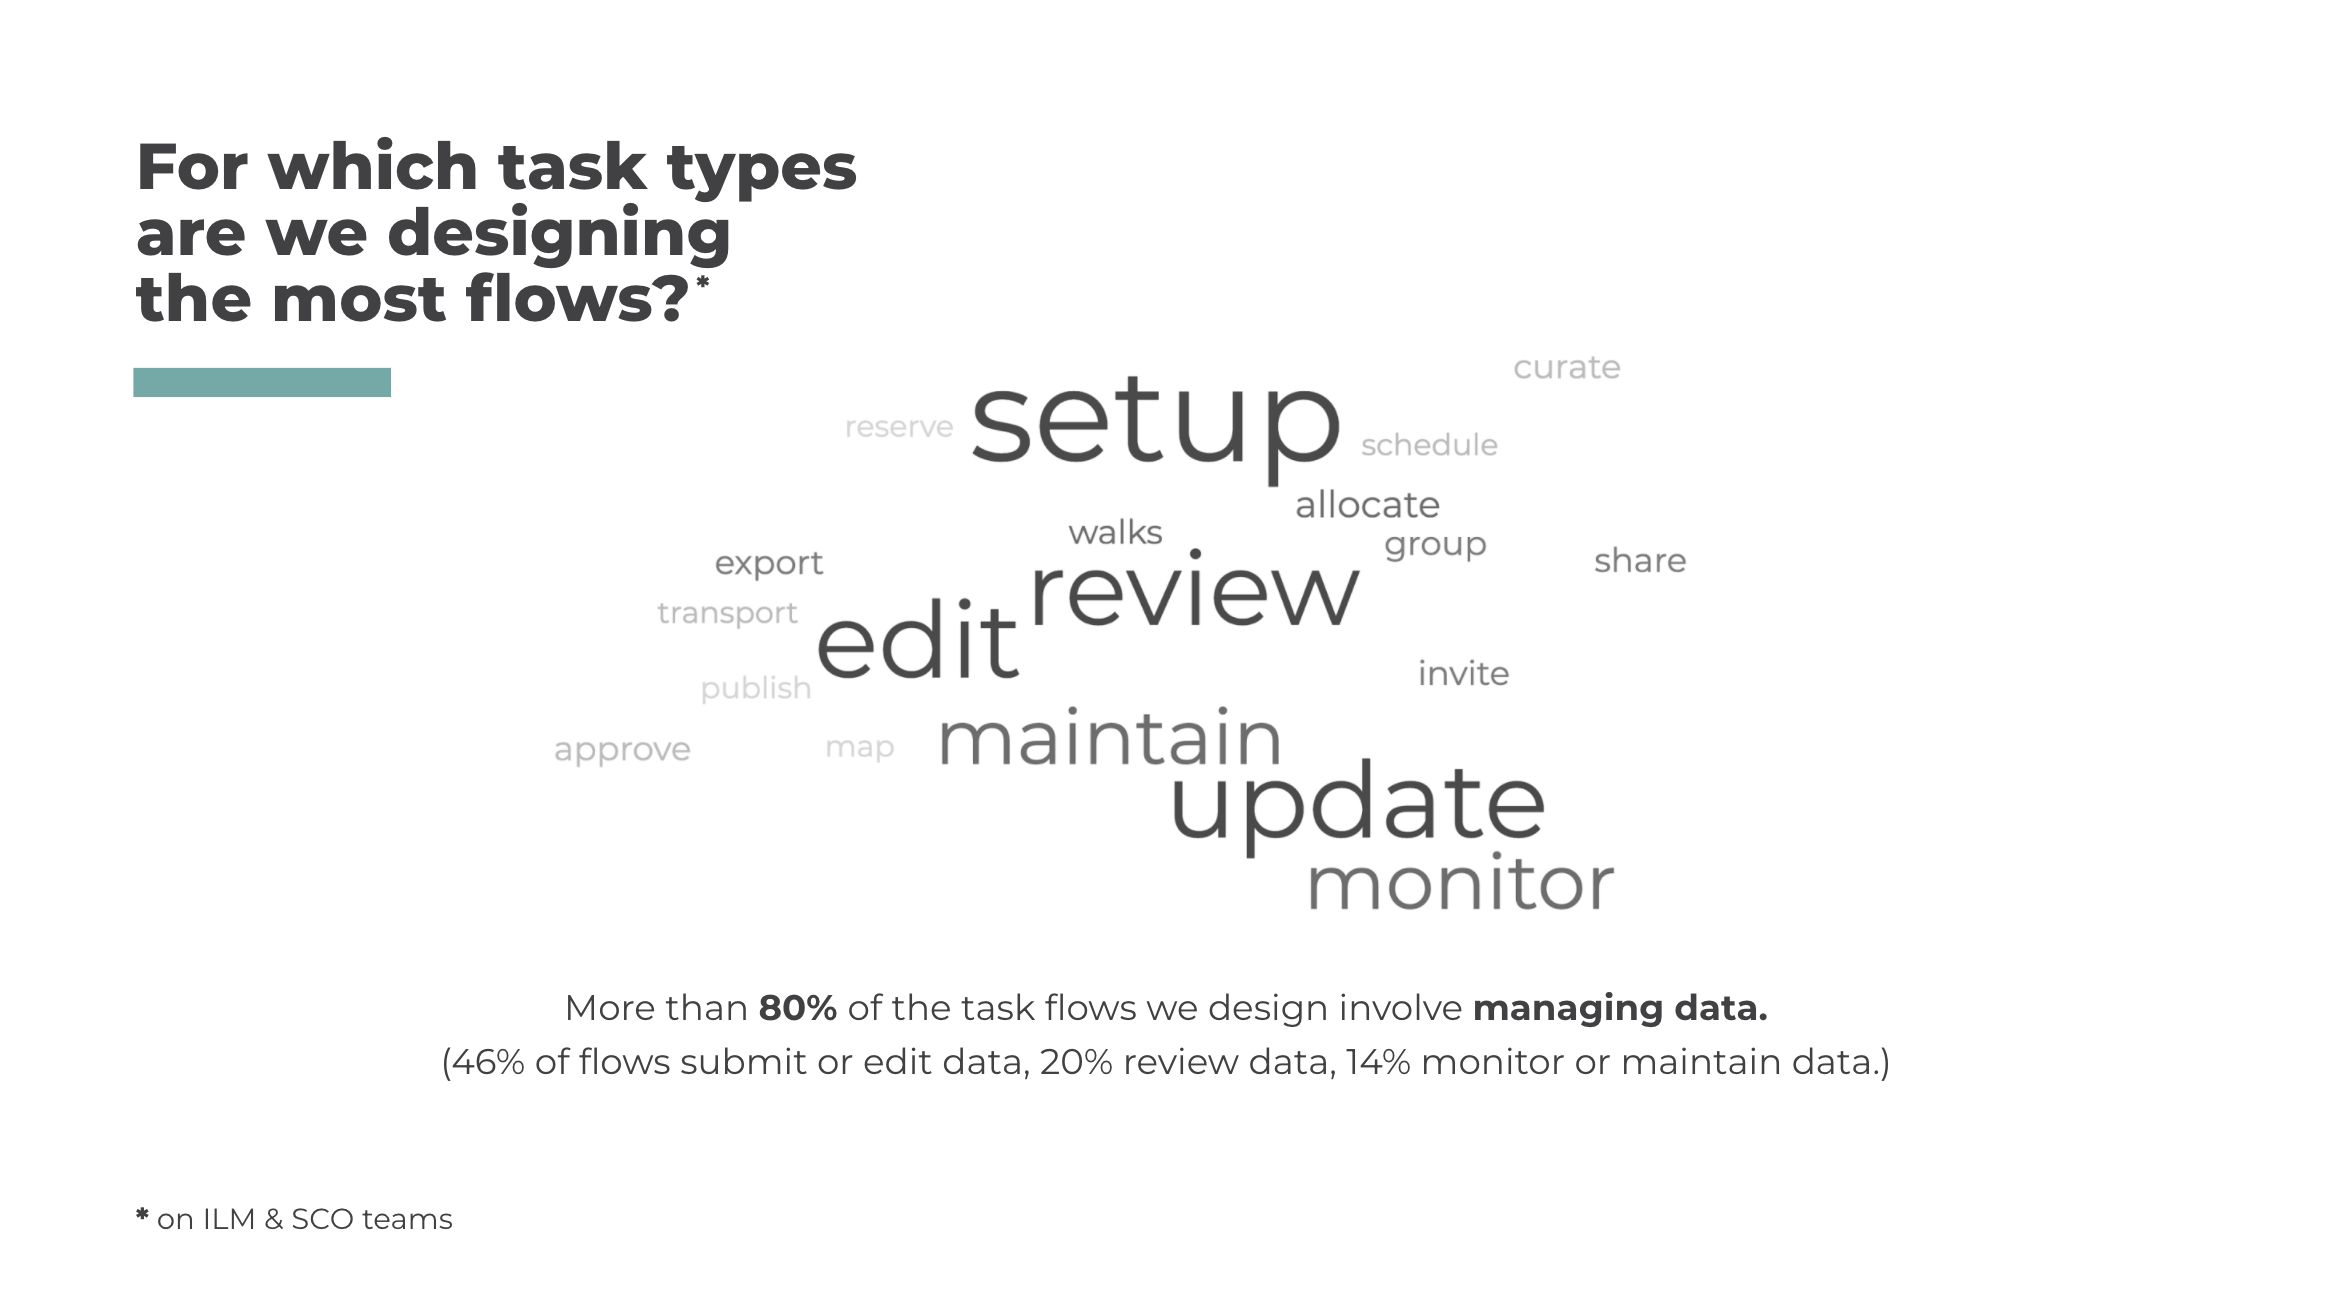
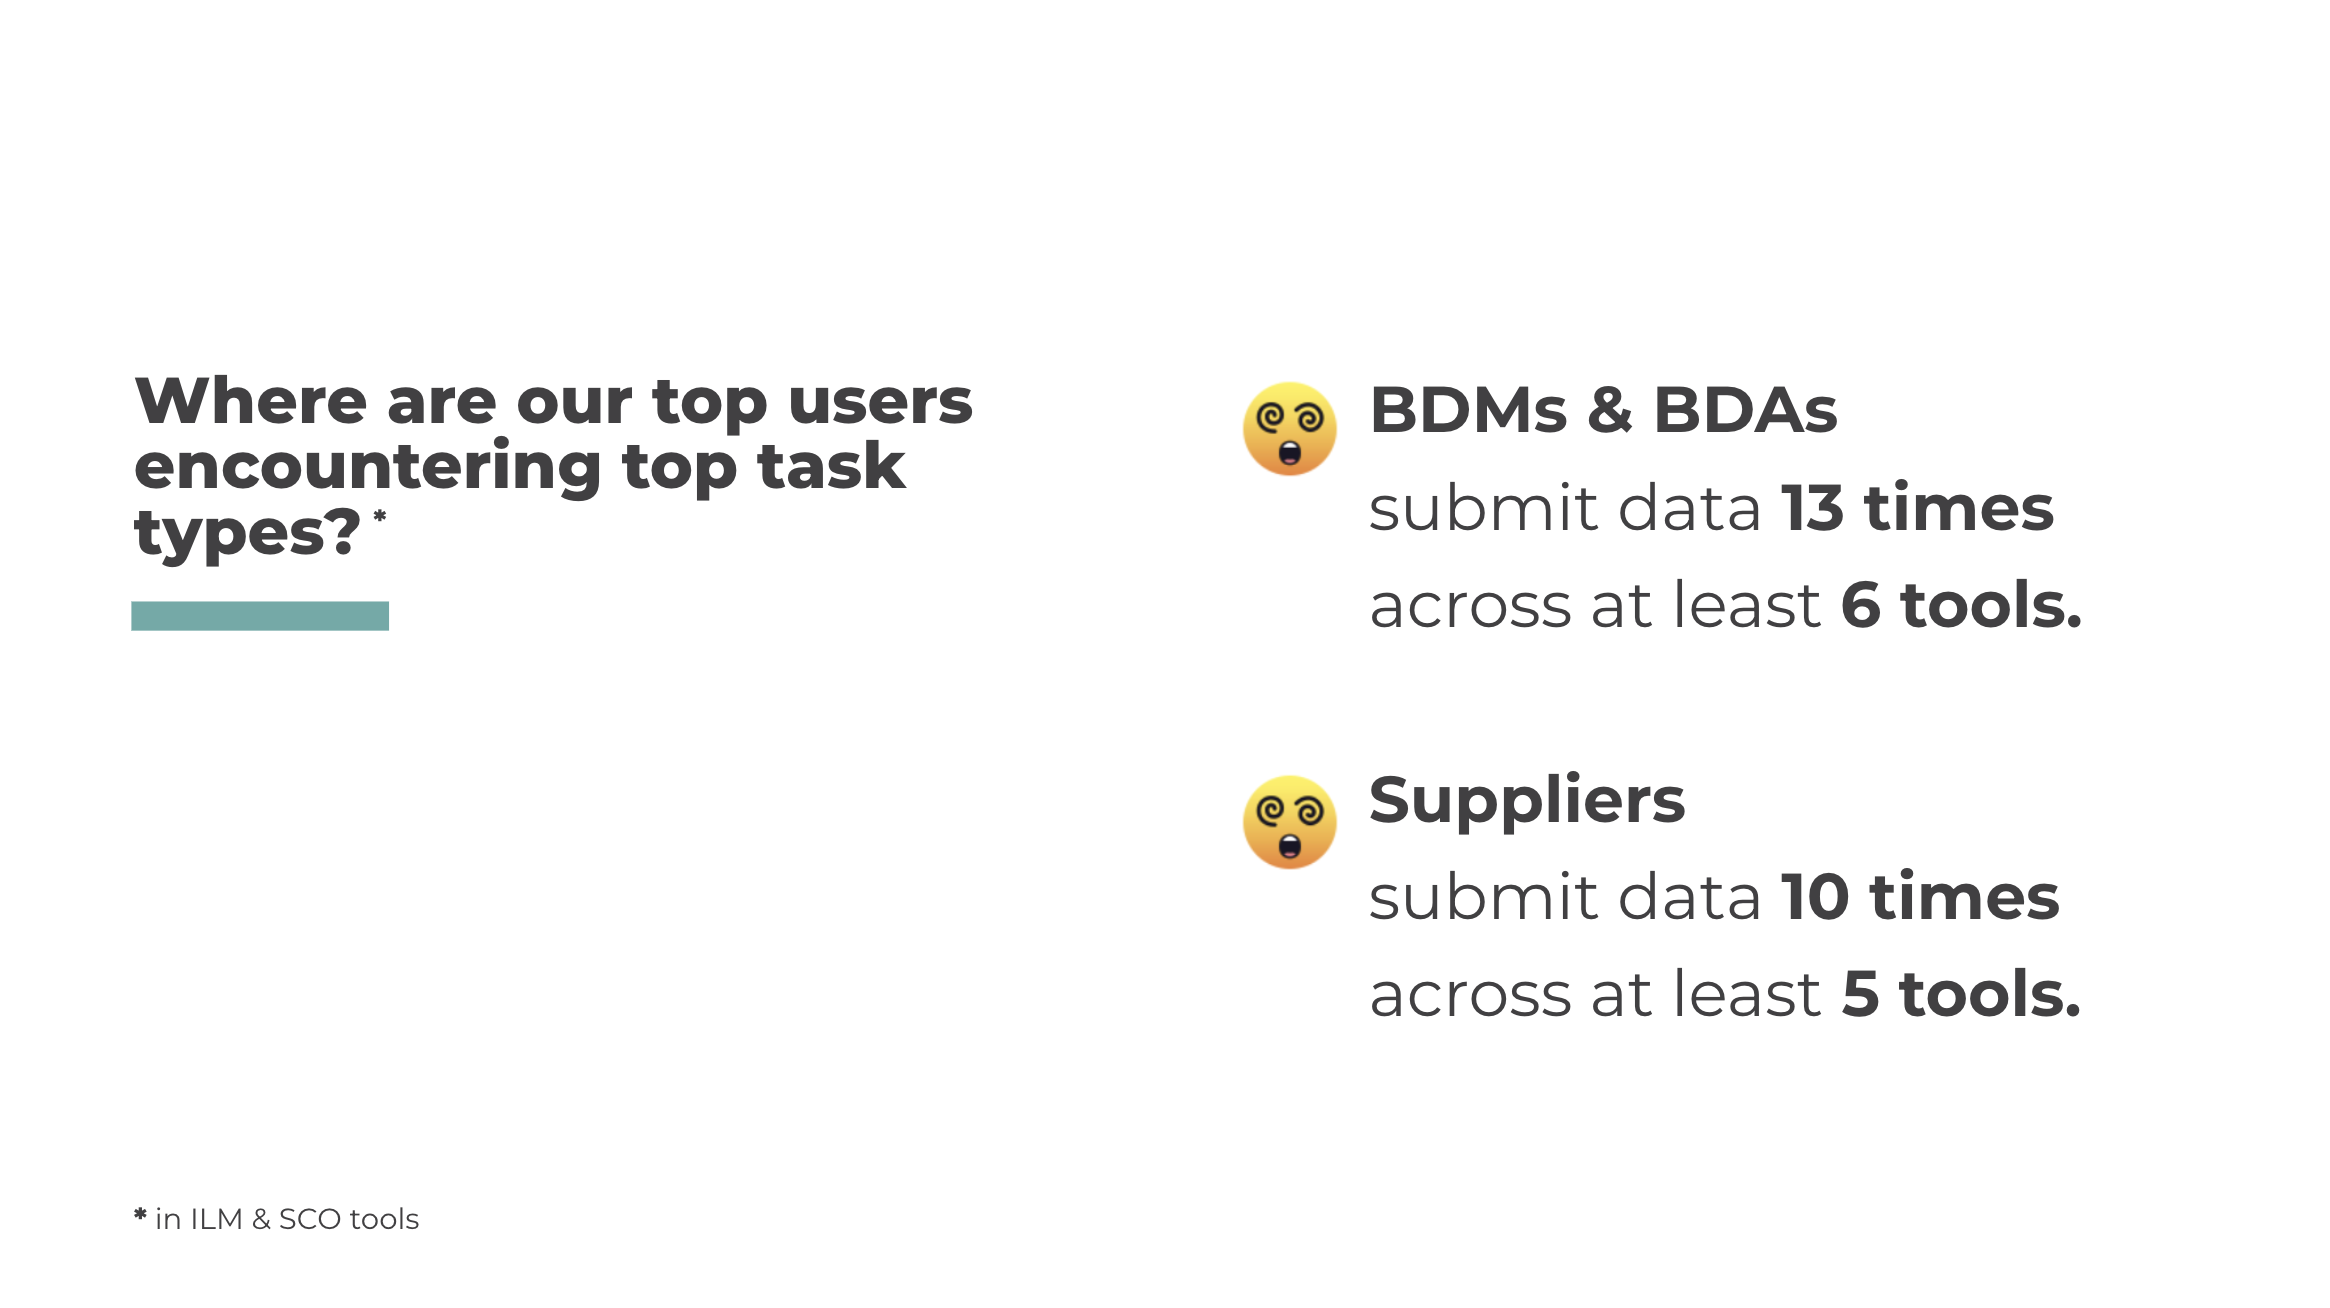
Findings
The audit and workshops kick-started a repository of user tasks flows and gave us a better picture of the partner jobs our squads were currently supporting, highlighting a lot of redundancy across task flows in our tools.
Cross-functional team interviews
We interviewed designers, product owners, and stakeholders across teams to confirm and uncover pain points, then grouped the findings into key problems an ecosystem approach could address.
Key themes
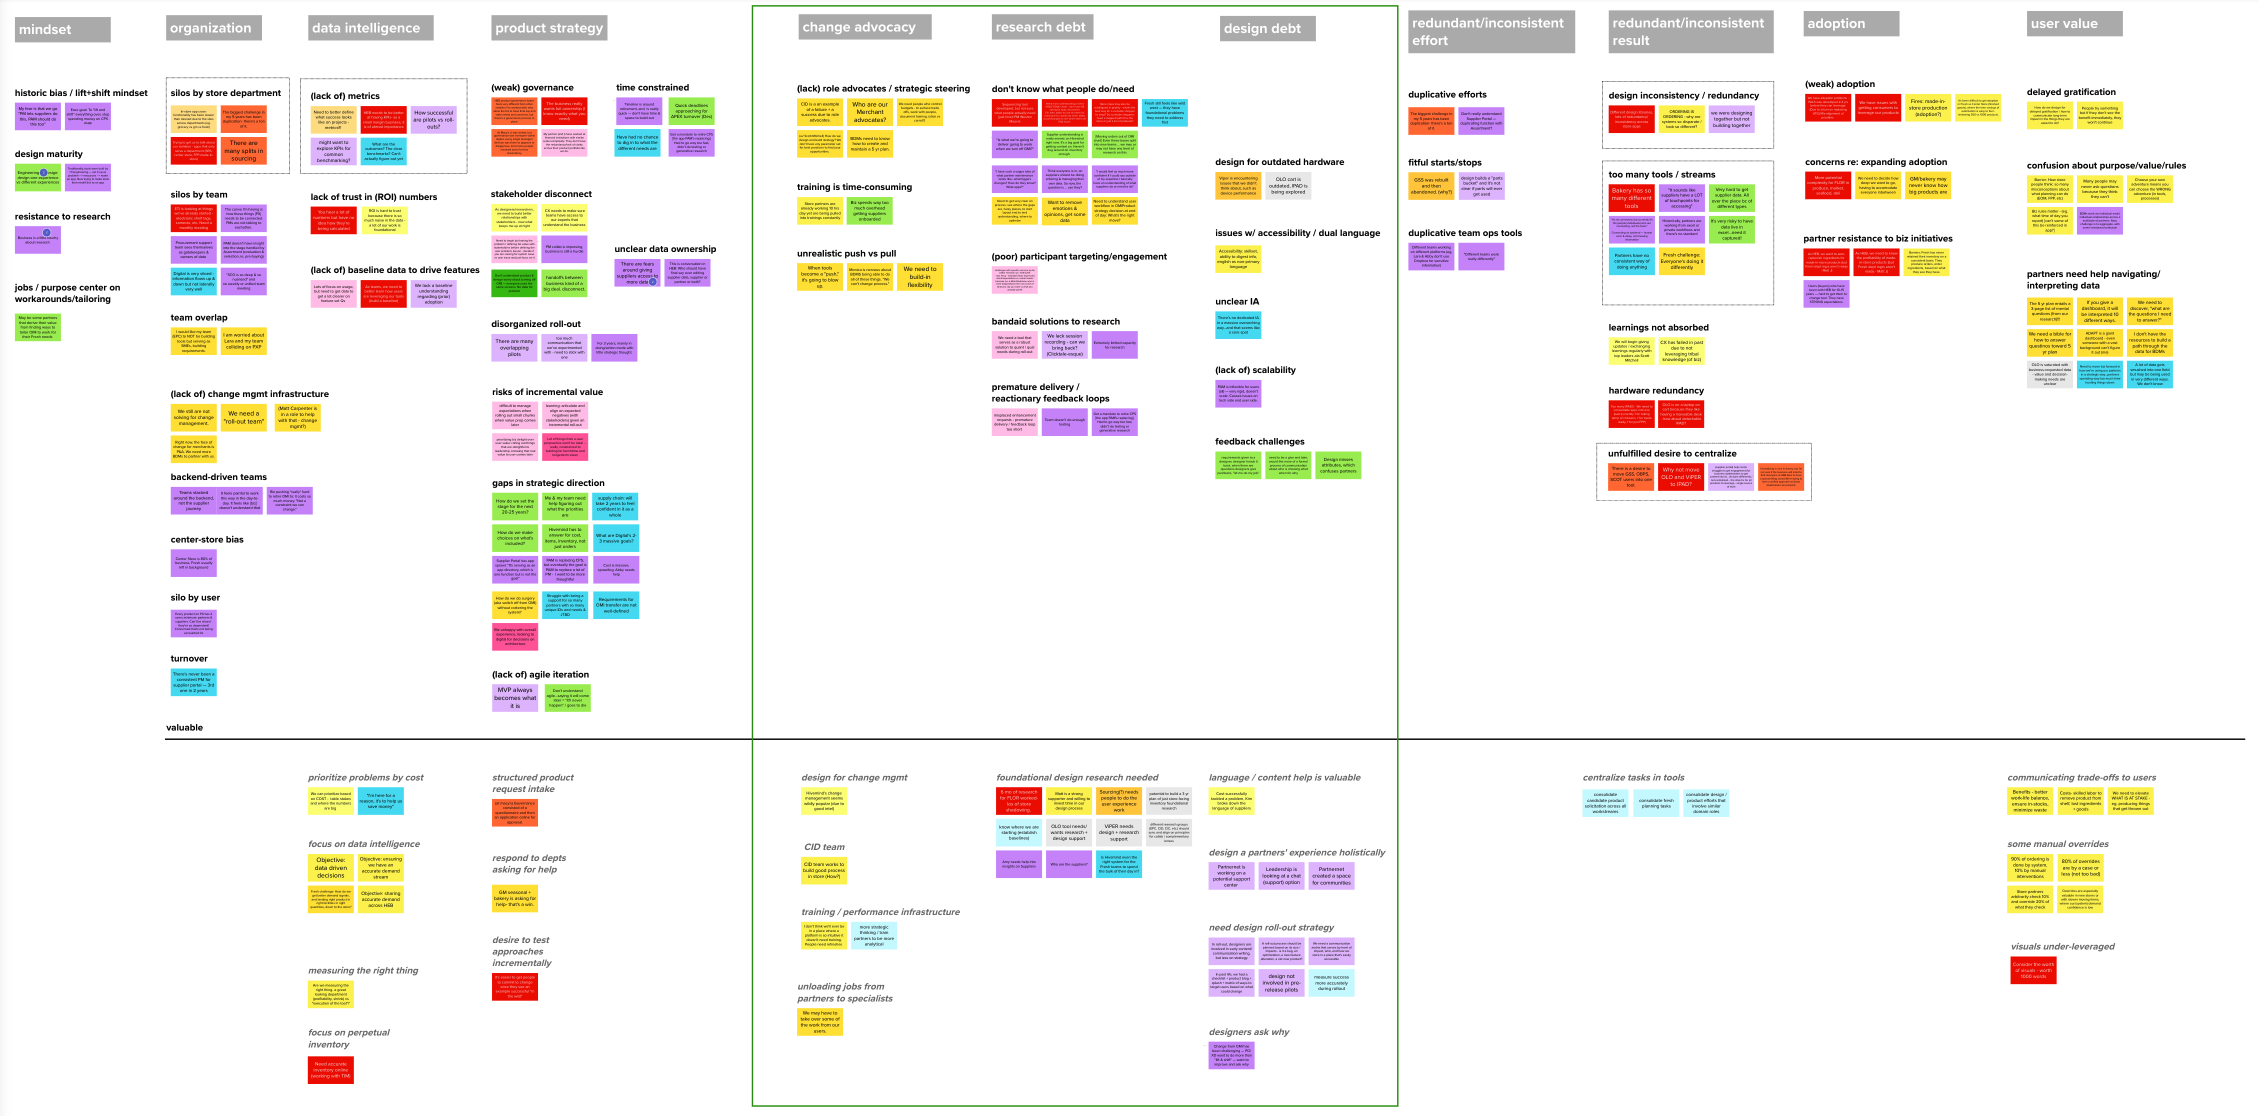
Synthesis
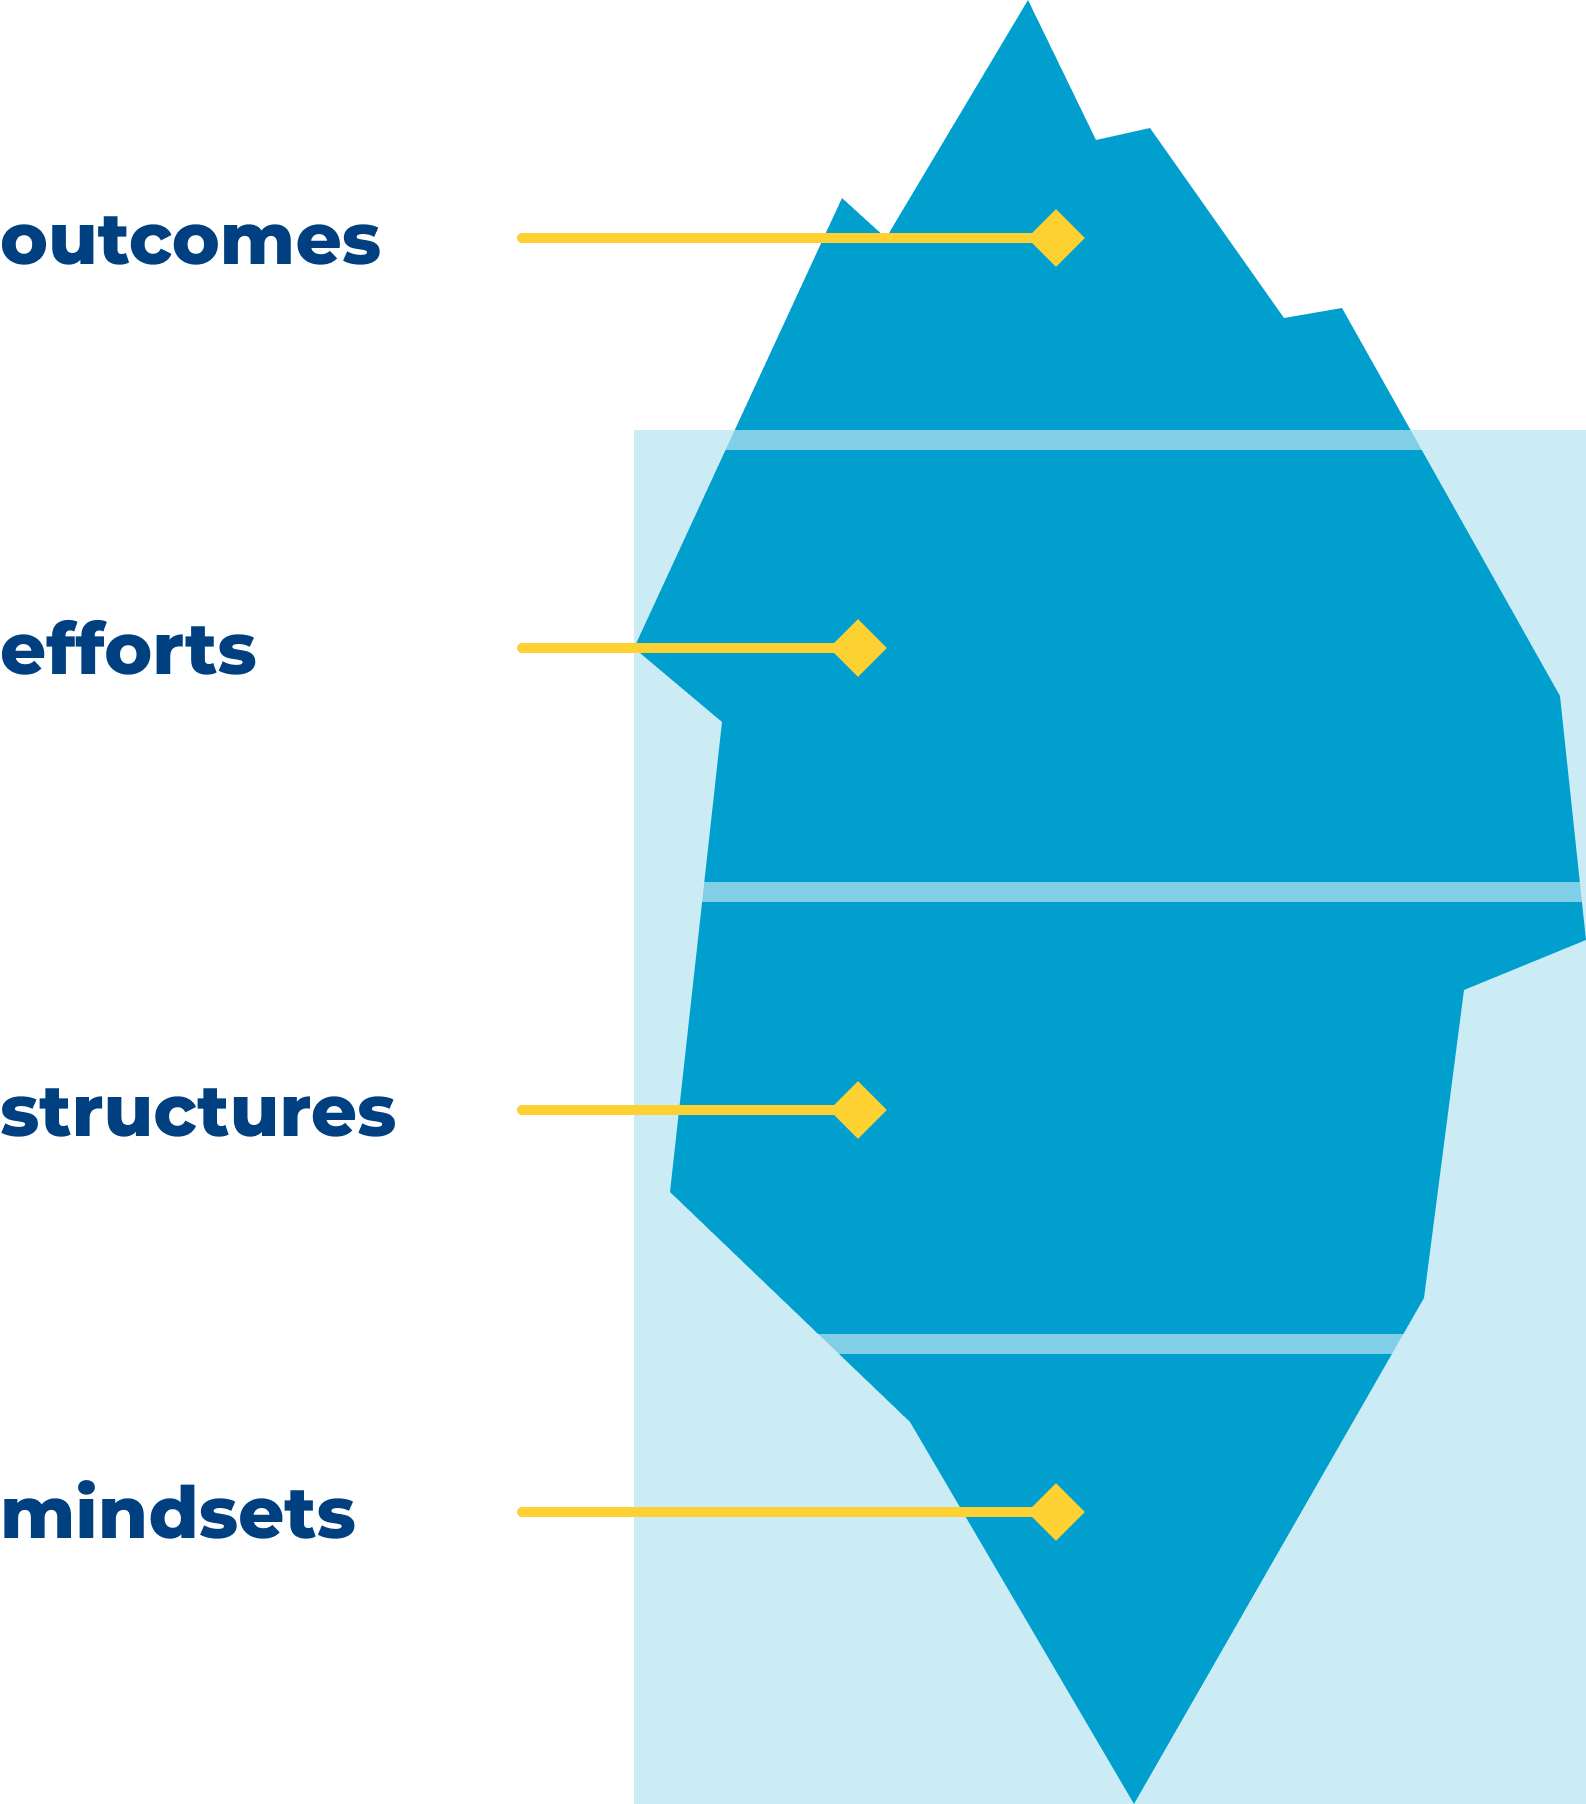
Iceberg model
While synthesizing our findings, we mapped the structural pain points shaping the enterprise ecosystem. To align design leaders and practitioners, we created a team share-out using the Iceberg Model framework, developed by System Innovation, to reveal four core pain points in our organization and how designers could reframe them for a healthier, ecosystem-led future.
Structural pain points
By sticking to existing approaches instead of seeking the best solutions, we created structural gaps and inefficient tools and experiences, making our work reactive, duplicated, and less effective.
Recommendations
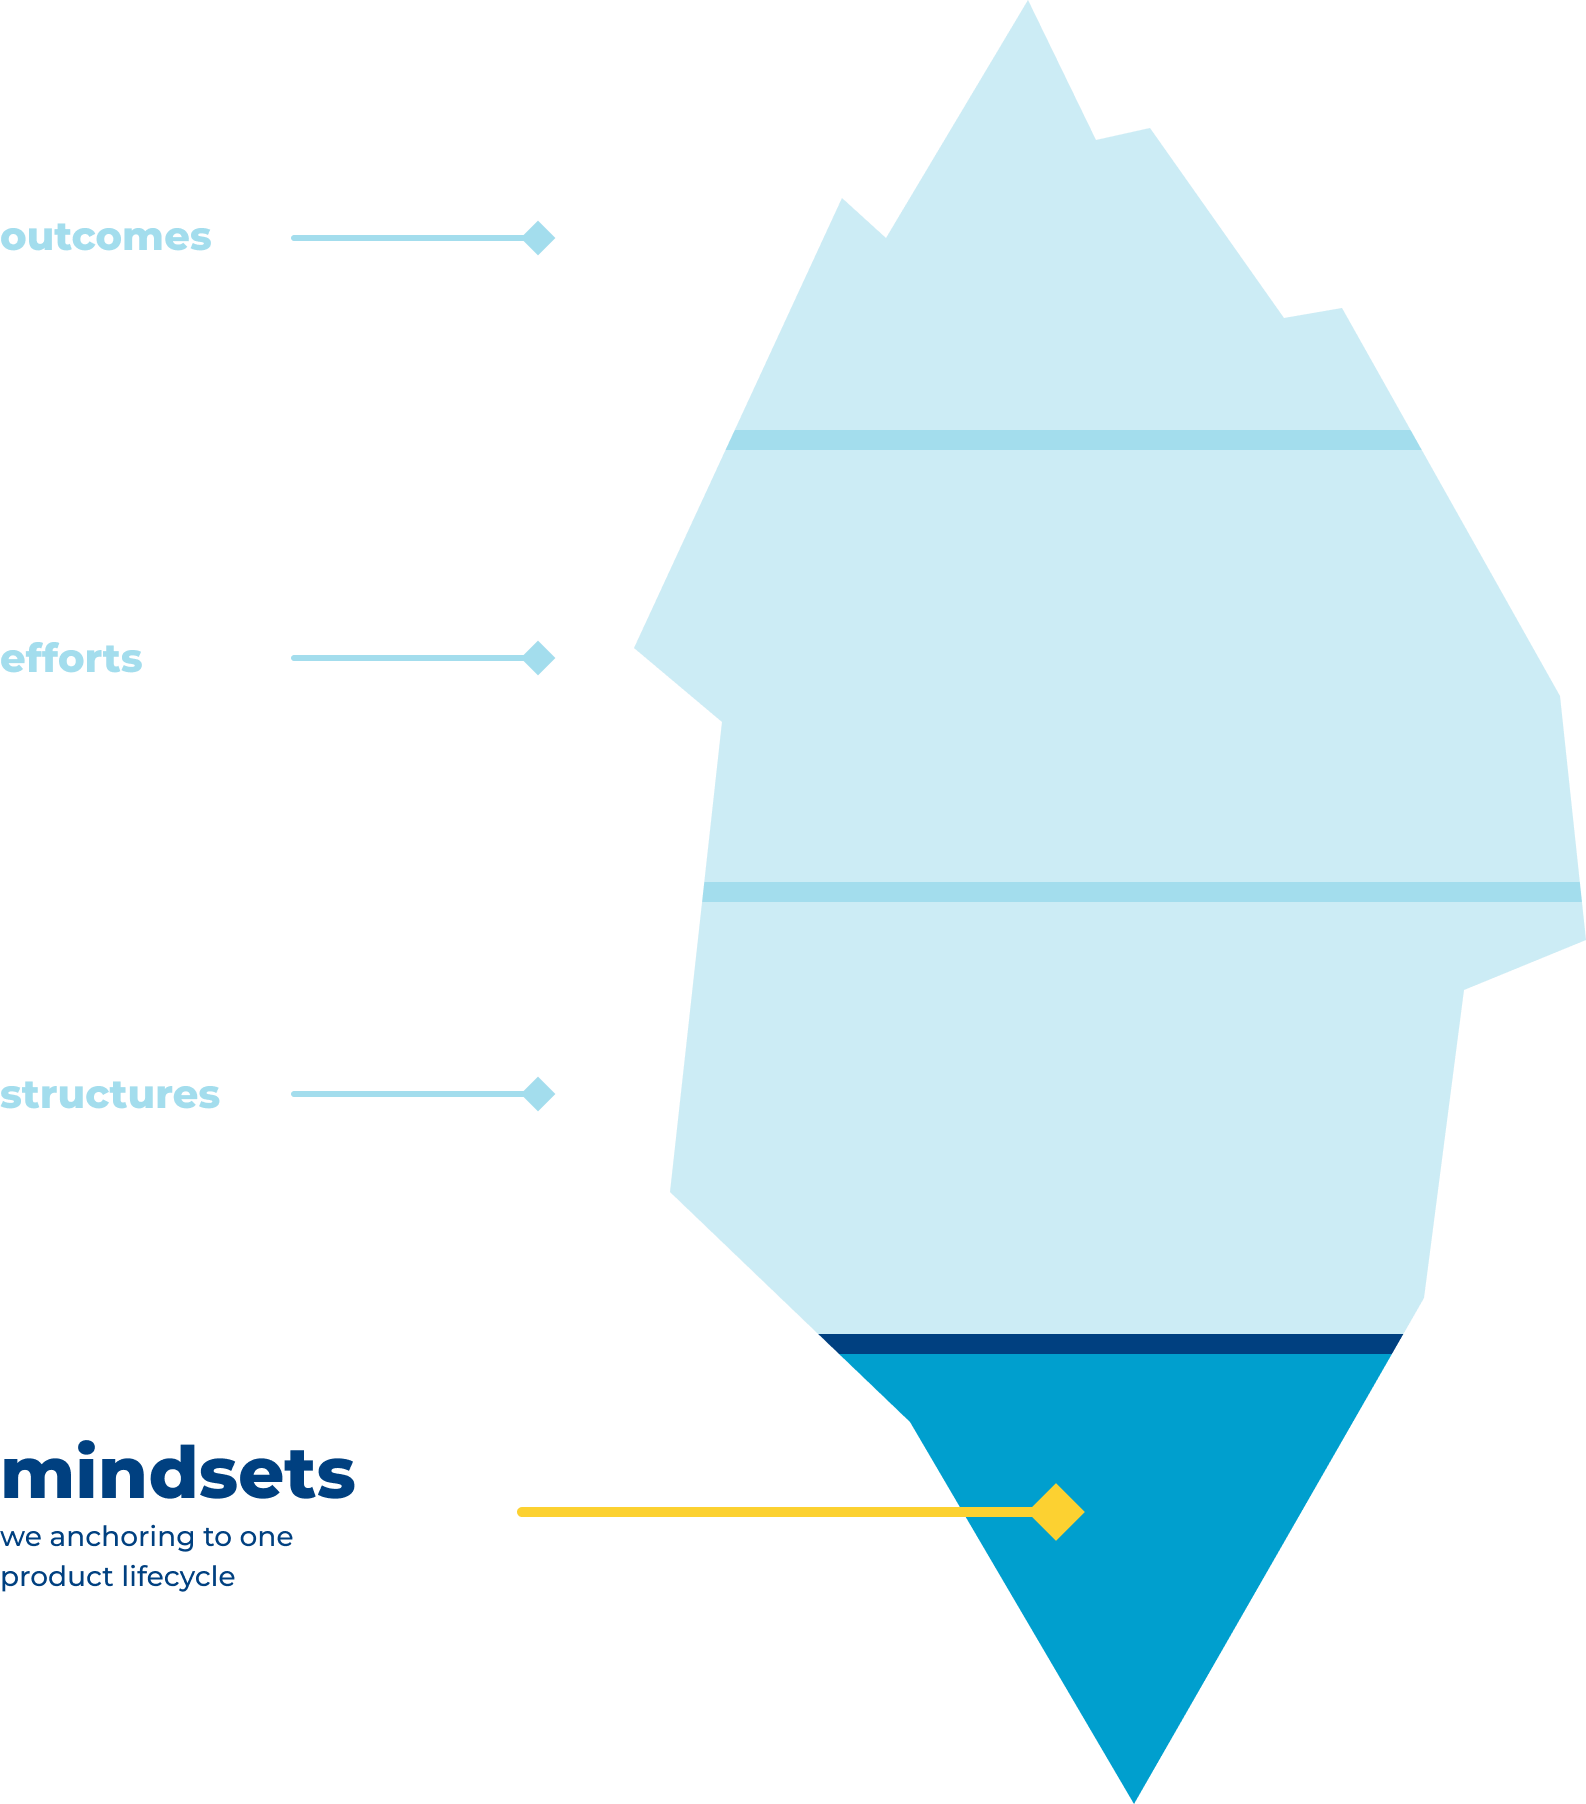
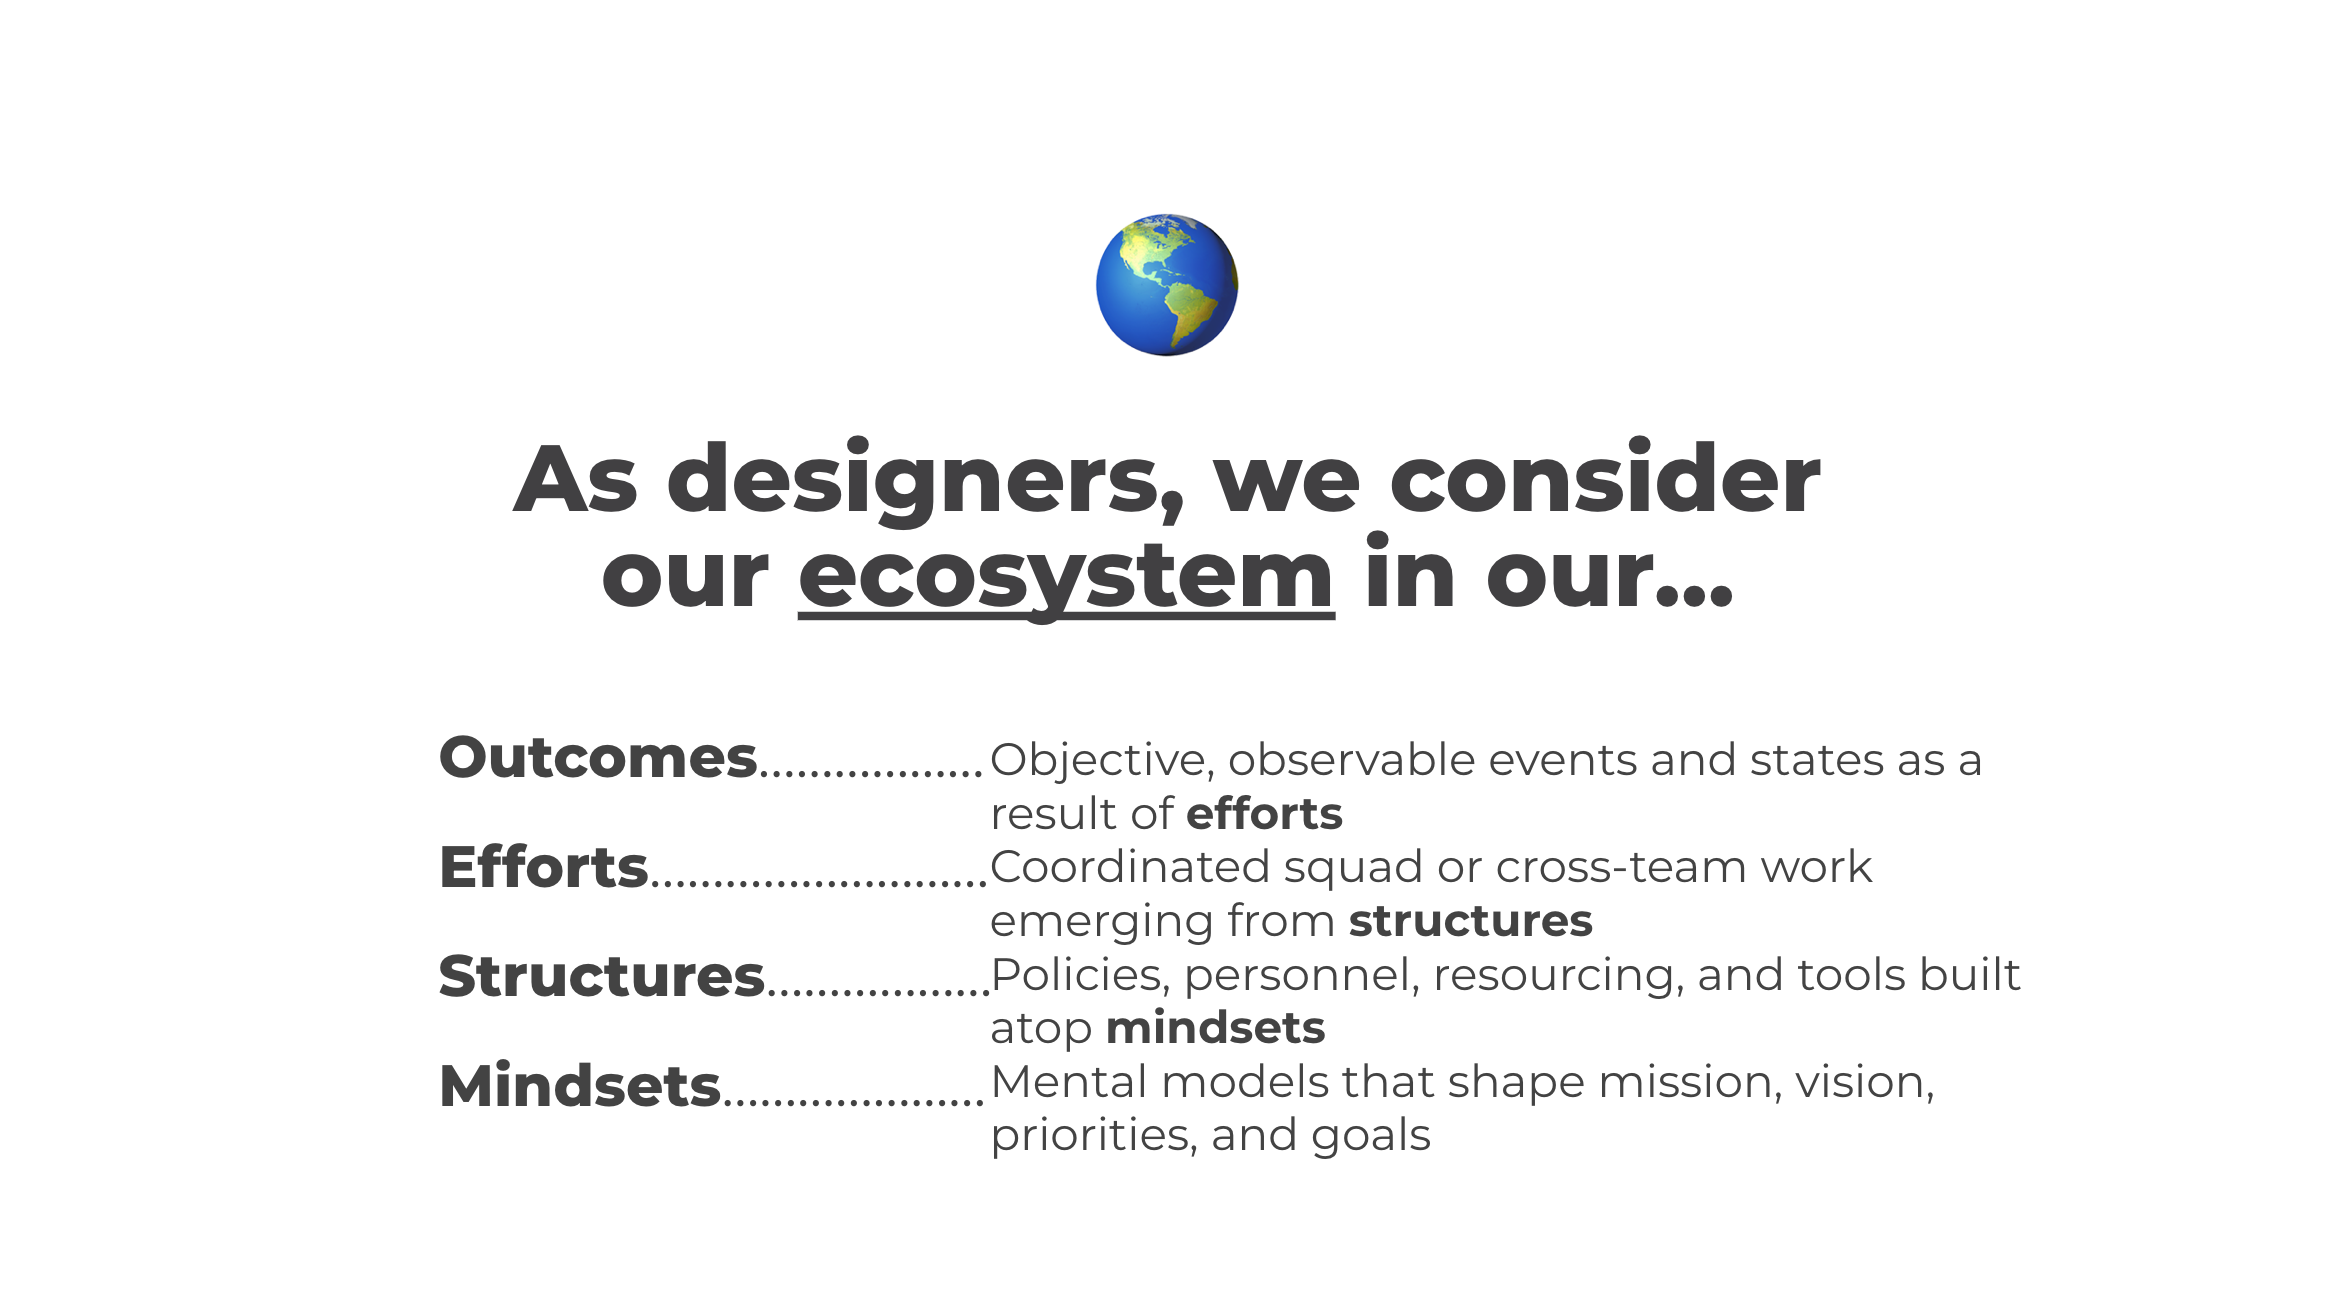
Mindsets
Our organizational mindset needed to be anchored to one product lifecycle
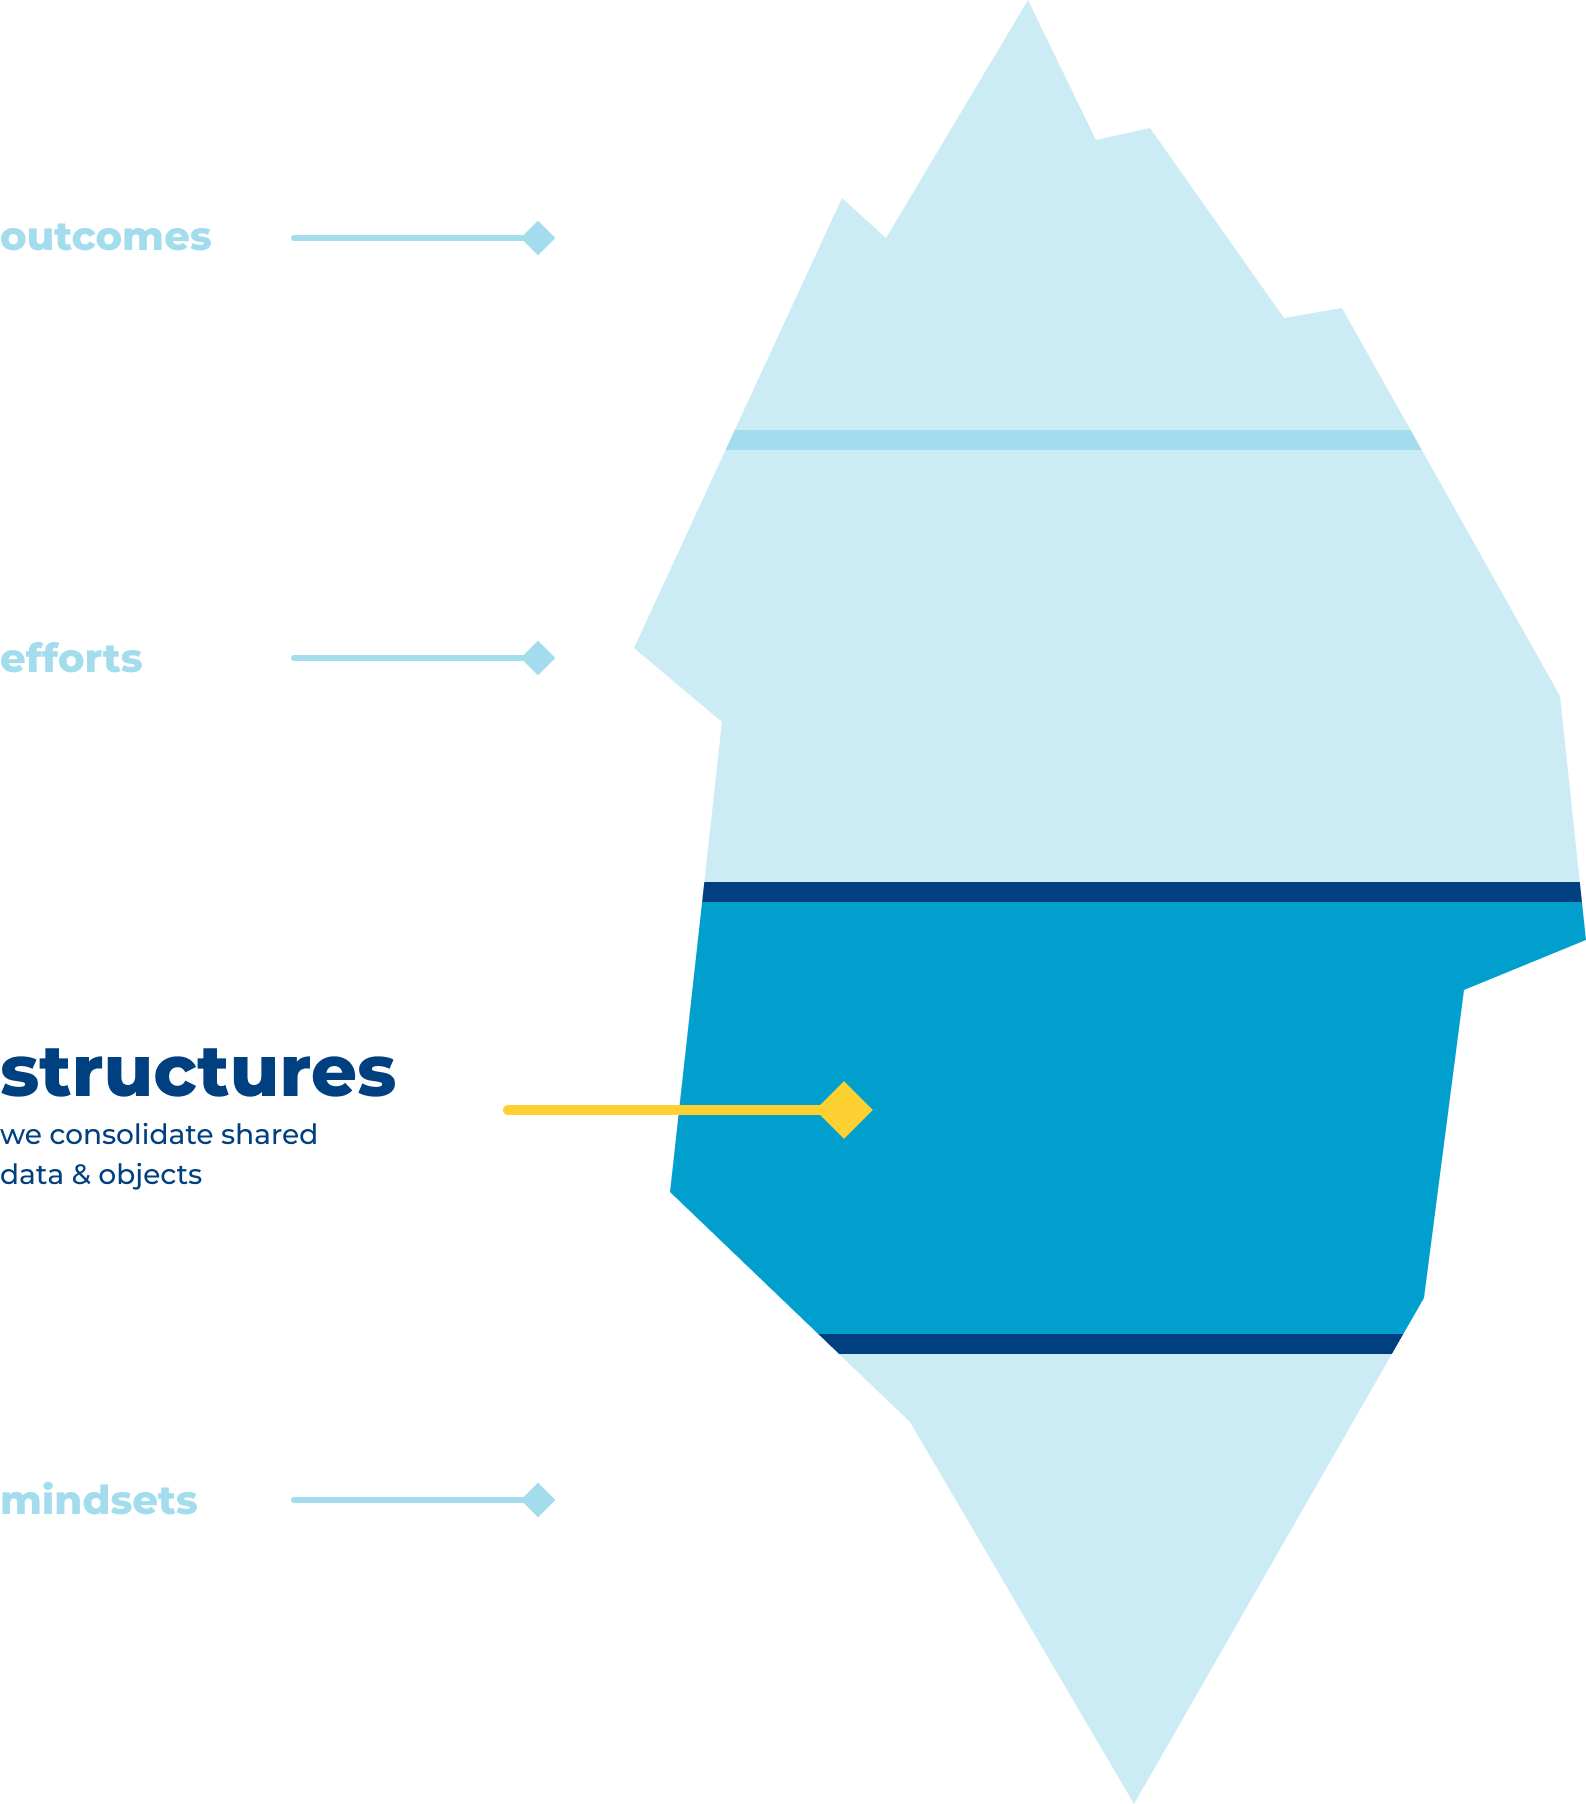
Structures
so we could structurally consolidate shared data and objects
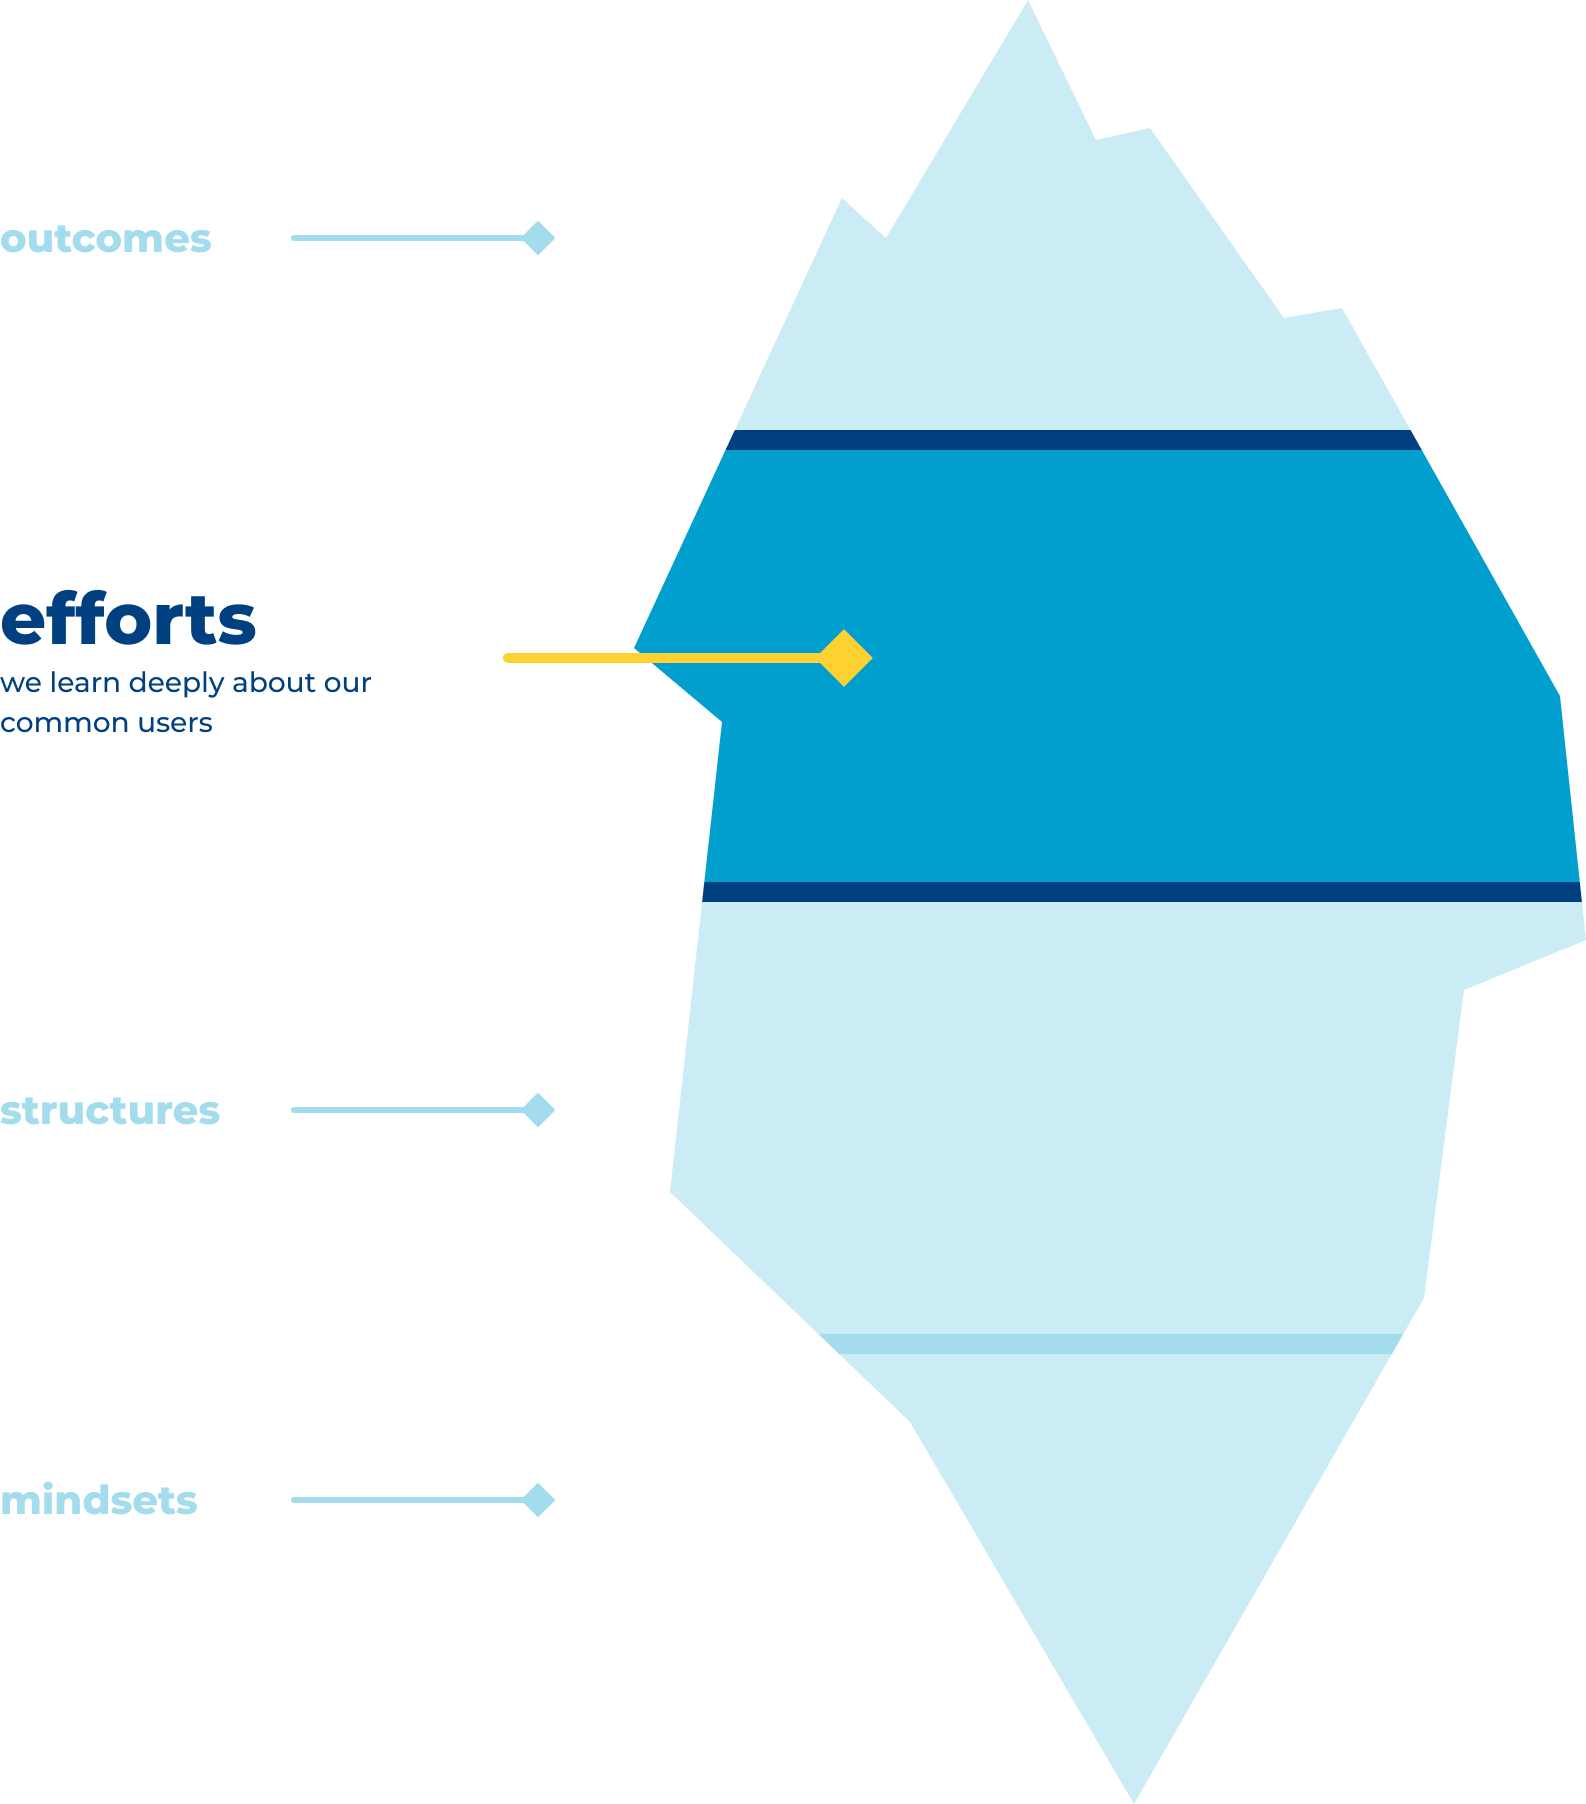
Efforts
informing efforts that allowed us to learn deeply about common users and co-design for similar tasks
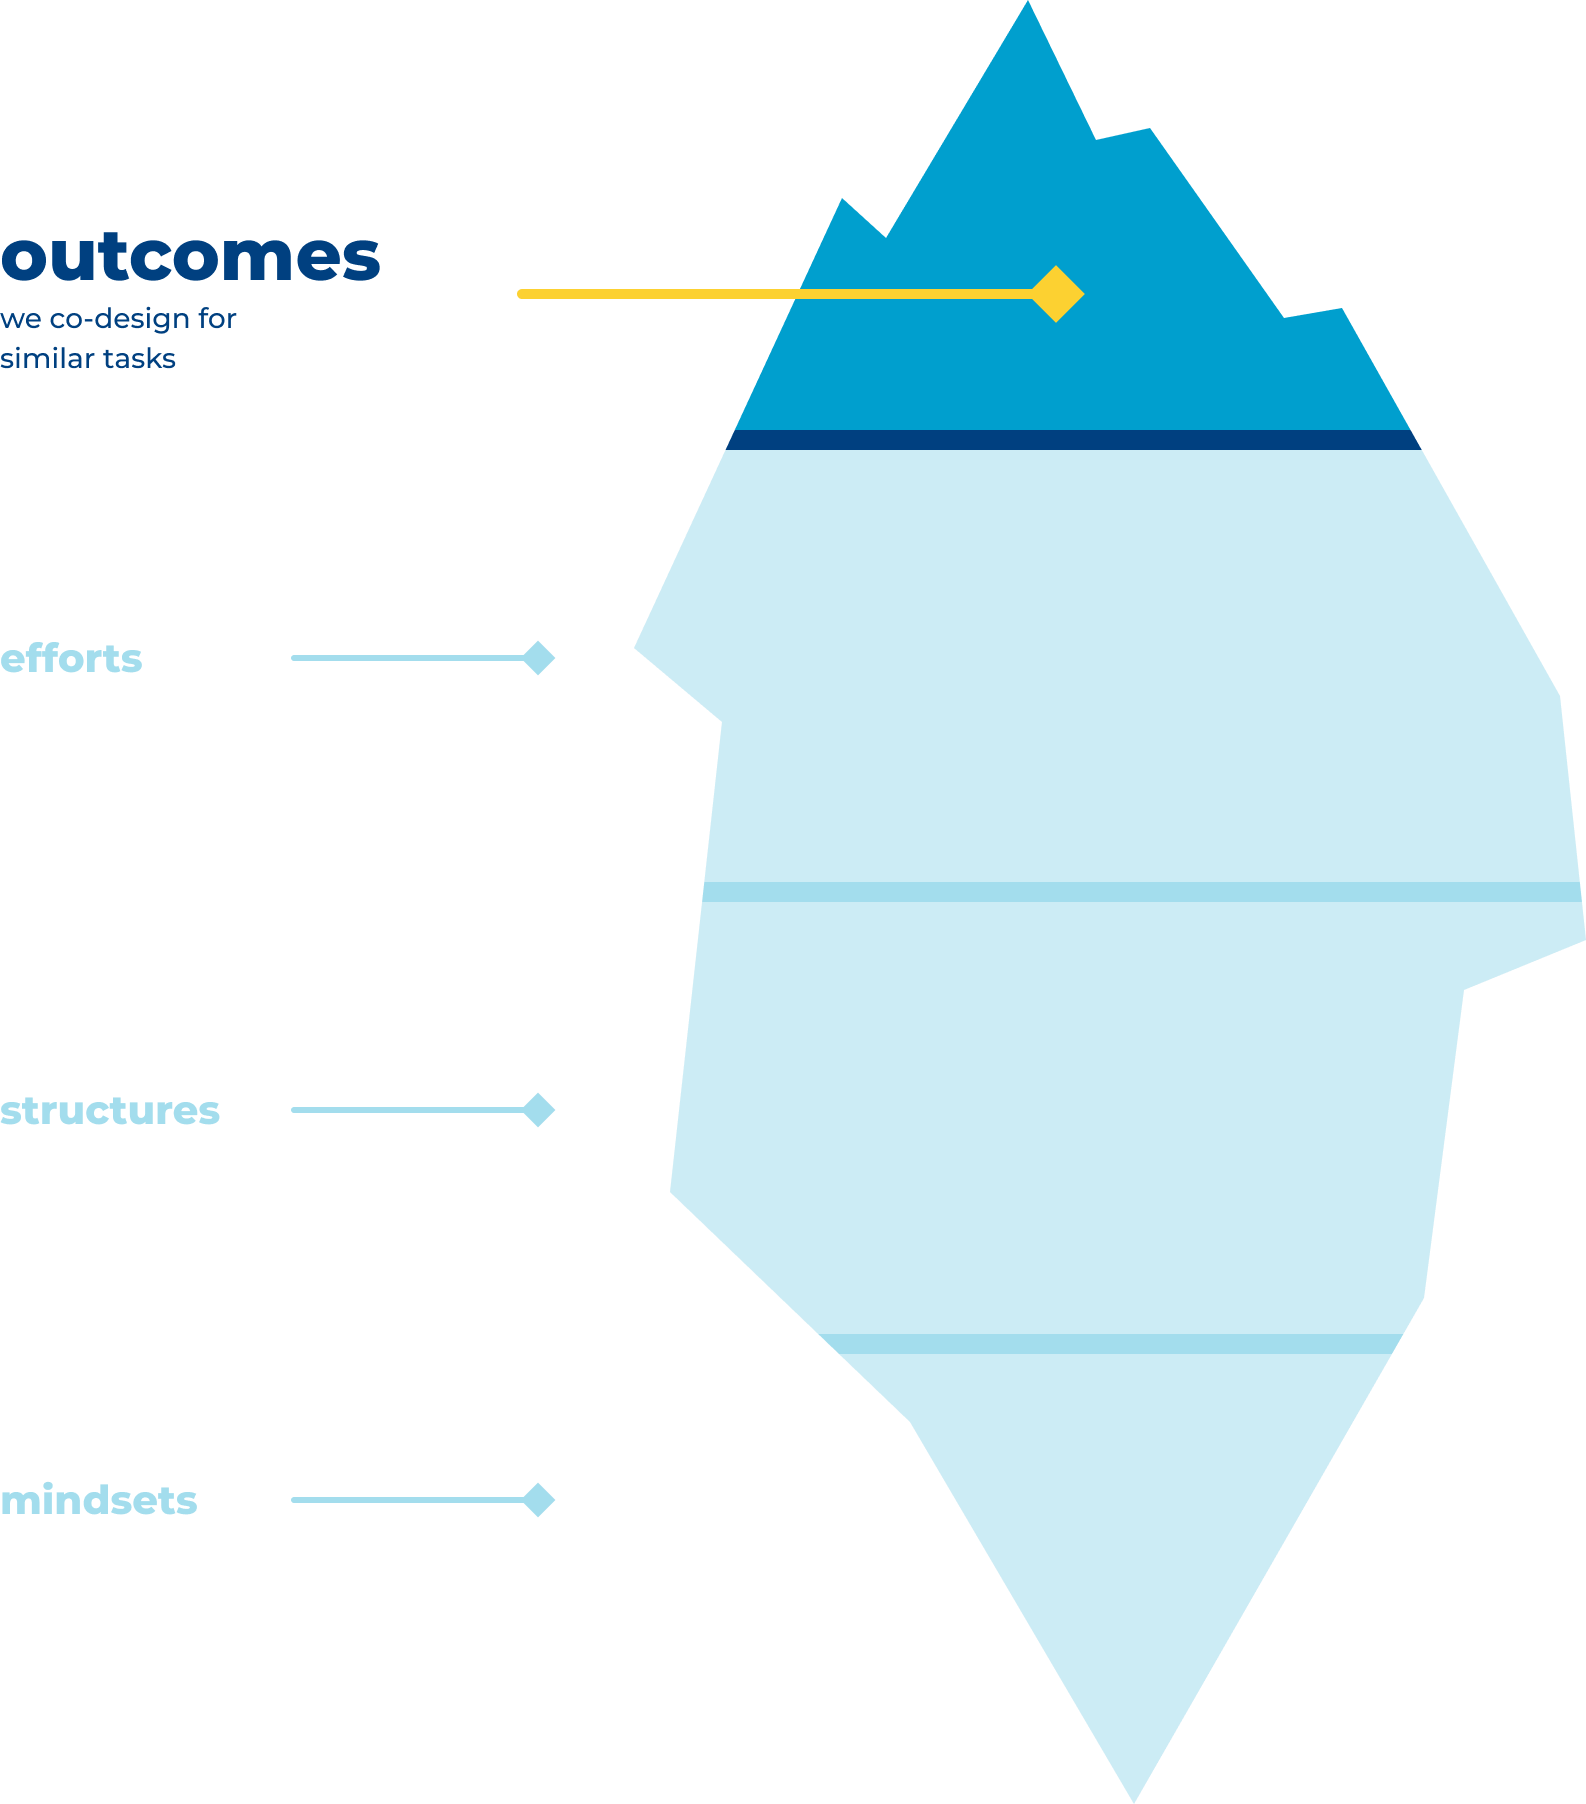
Outcomes
that tracked to common desired outcomes
Designer toolkit
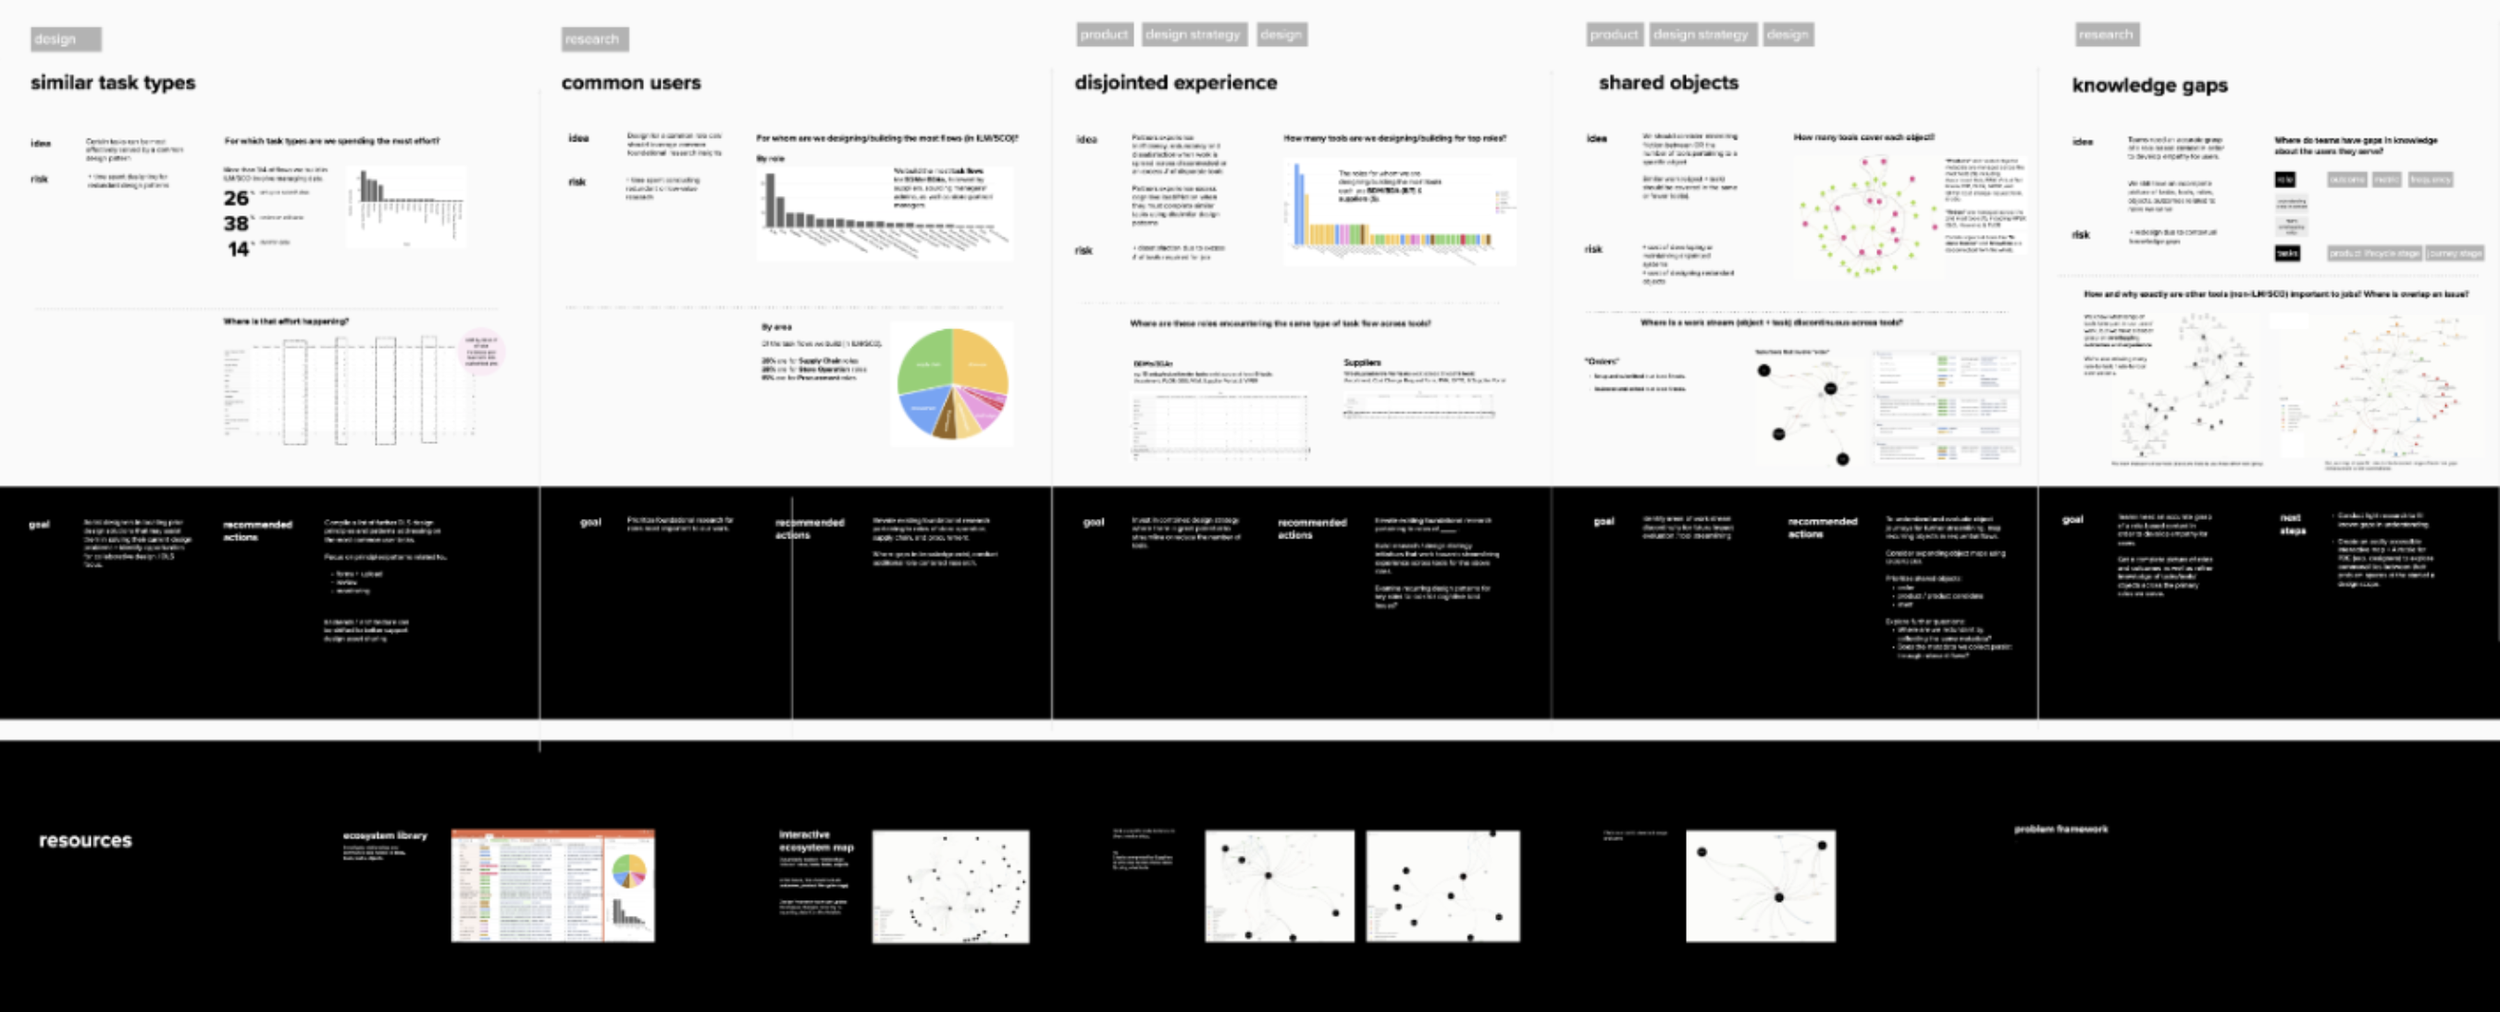
While the Iceberg Model was important for bringing our work to the teams, we wanted a way to visualize our analysis, key problems, and the data we’d gathered. We started mapping out an early and experimental design toolkit with potential frameworks and resources that could help designers collaboratively solve problems and help our org move closer to the ecosystem we wanted.
The toolkit was comprised of an early set of framework ideas that could help our design teams craft solutions that move them, their projects, and the org closer to an ecosystem that tracks desired outcomes, where we can learn about common users and tasks, look across teams by using shared object models and data, and think about a holistic product lifecycle.
The toolkit’s experimental artifacts were meant to be used across a variety of mindsets a designer may be in when crafting project goals, scope, and collaborate with product owners and stakeholders.
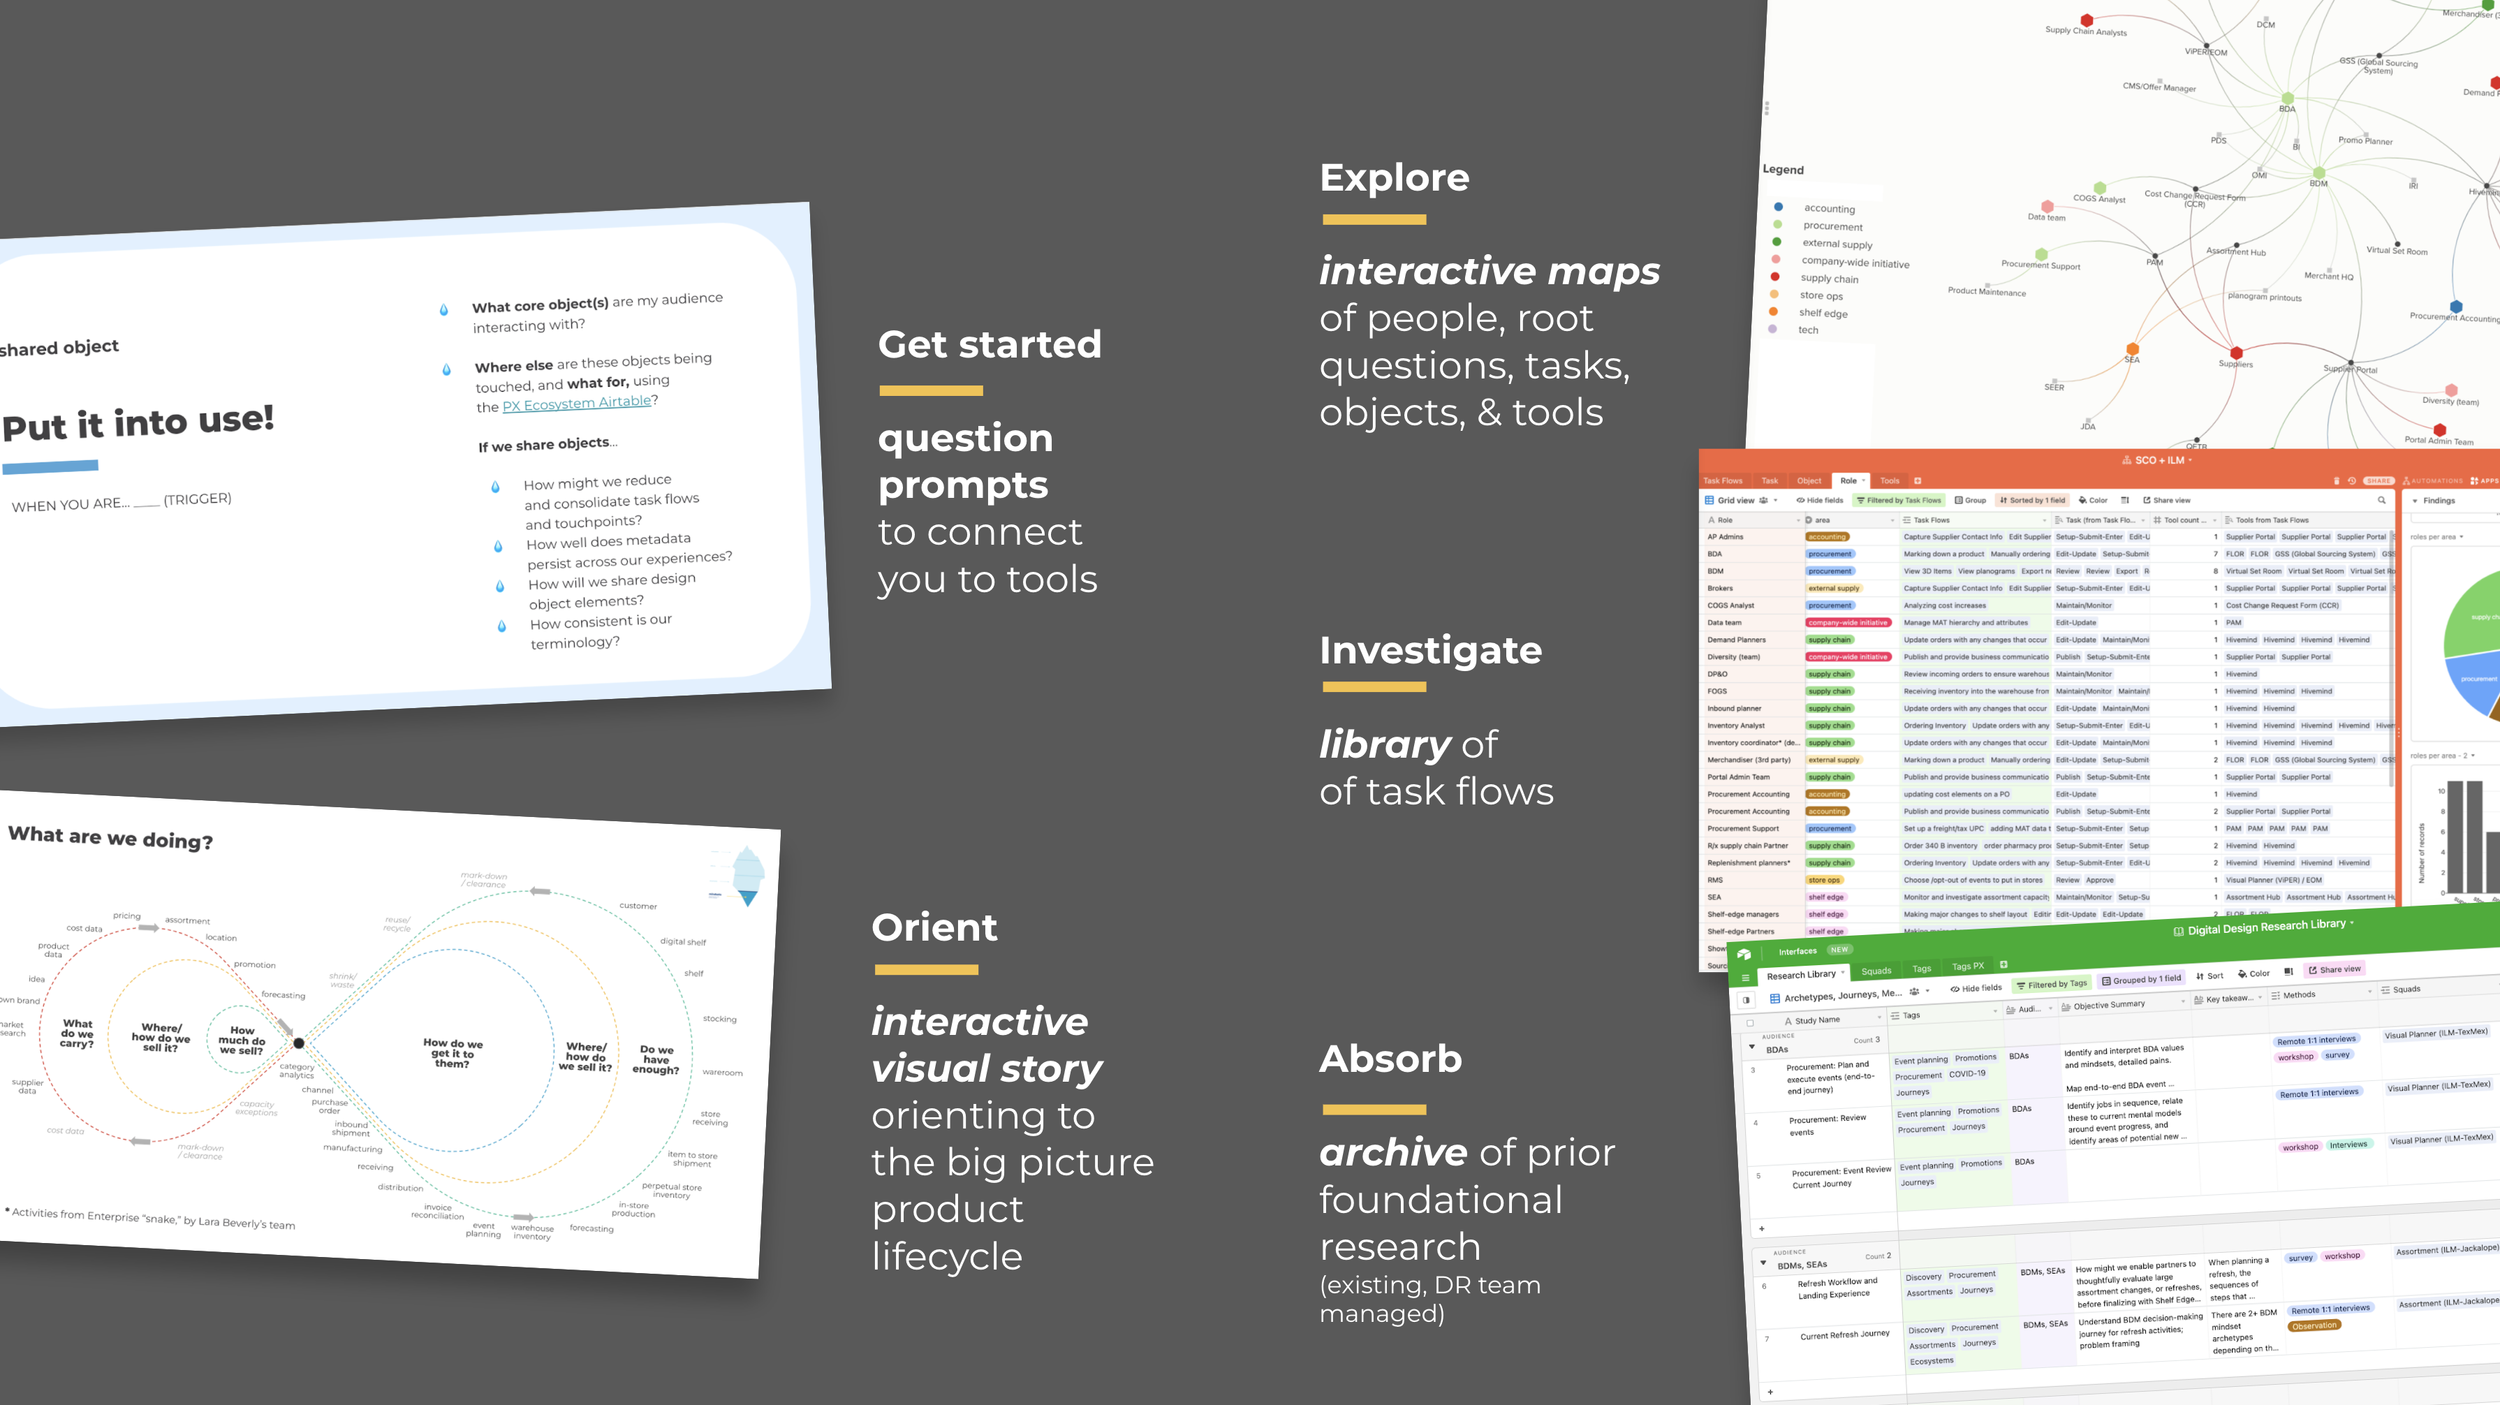
Toolkit service map
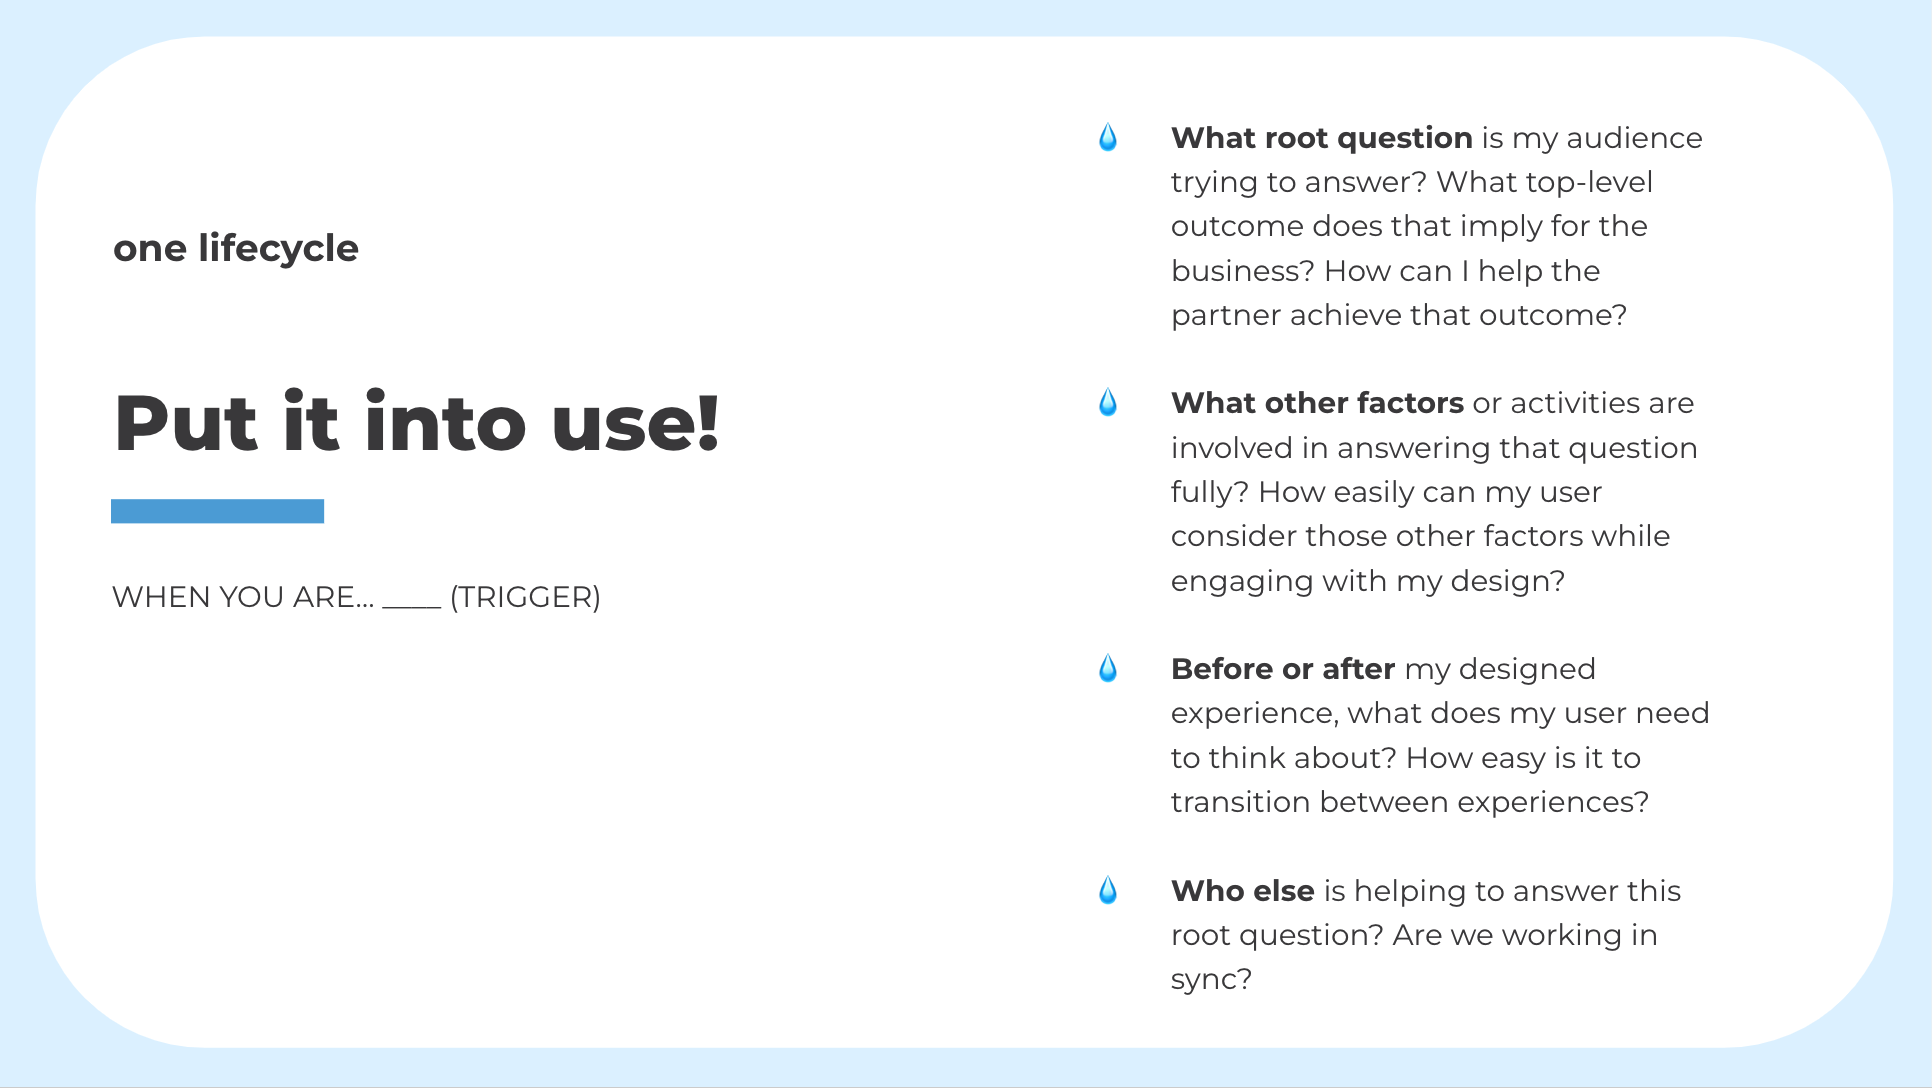
Question prompts
A set of question prompts to help connect designers to frameworks and other designers asking similar questions.
Tool: Shared Figma Resource
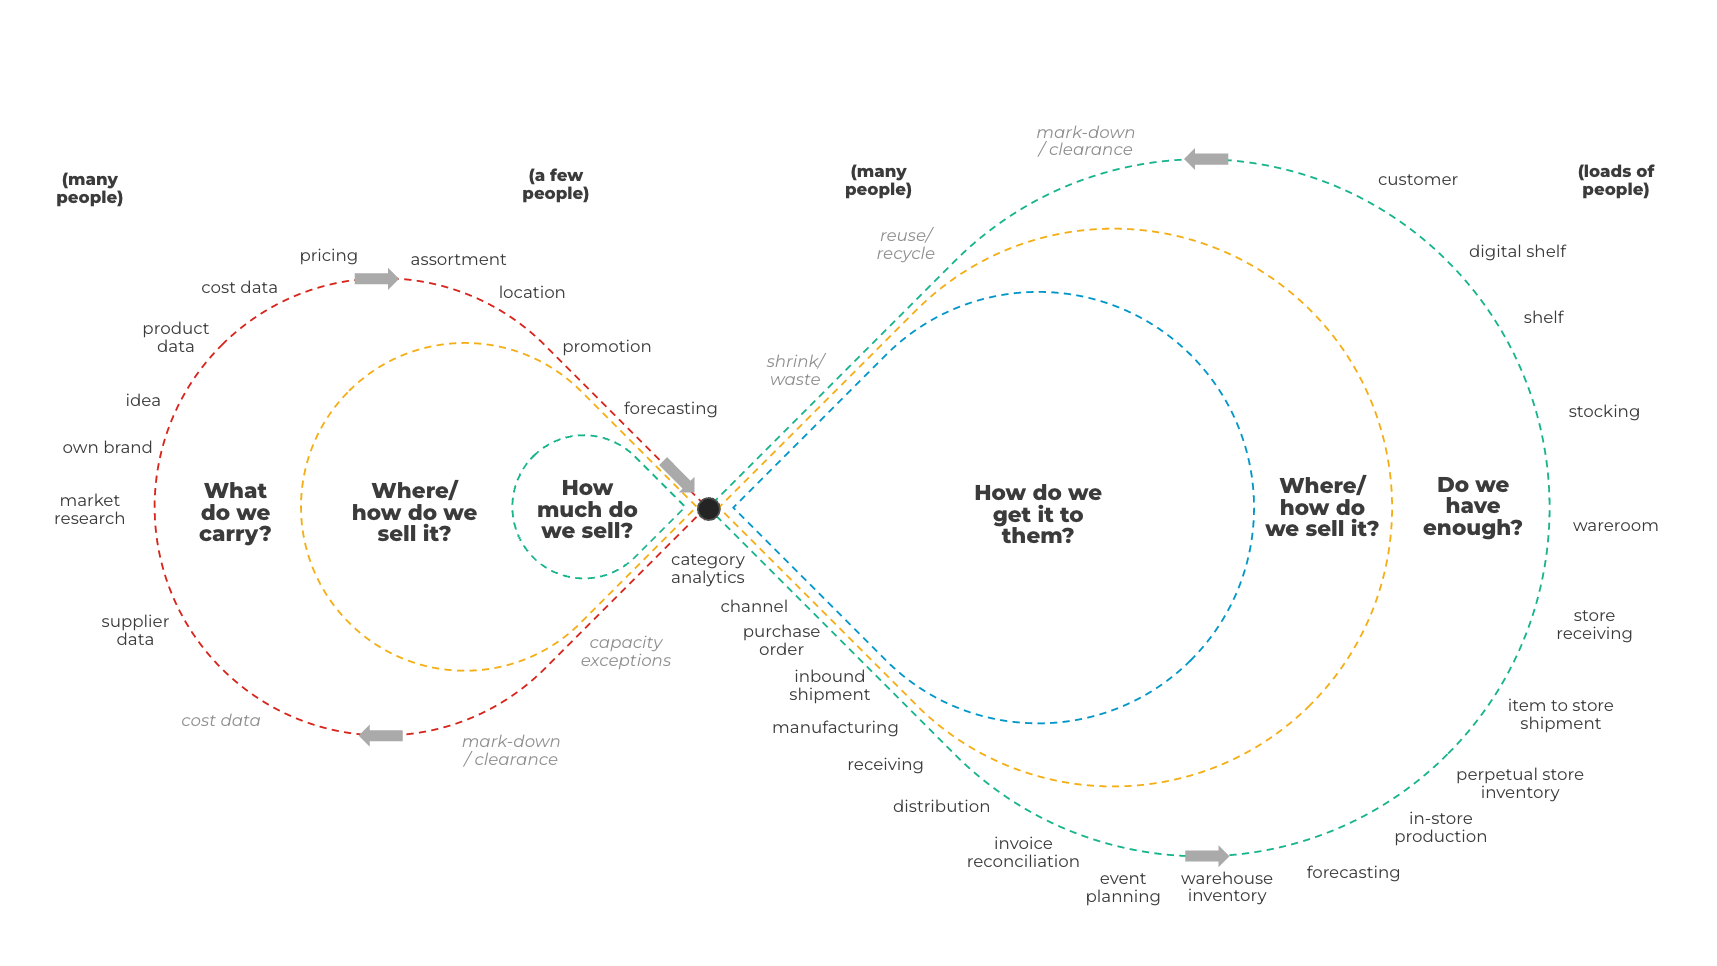
Product lifecycle diagram
A new visual representation of the “snake” diagram that more accurately represents H-E-B’s product lifecycle, helping orient designers to the big picture of the Enterprise space.
Tool: Shared Figma Resource
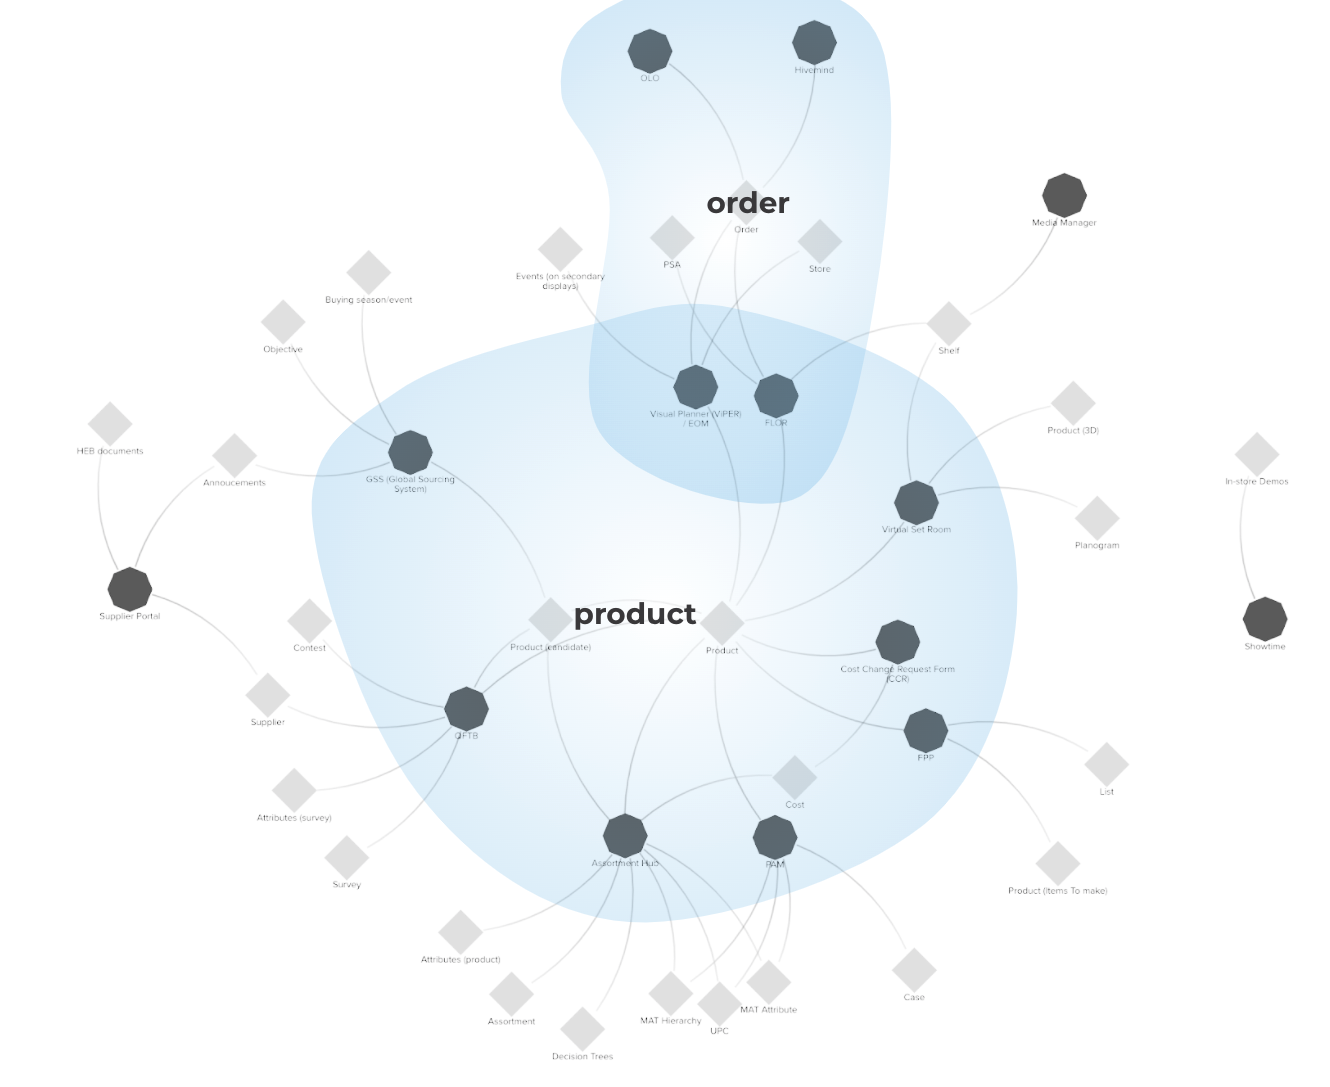
Shared object map
A set of interactive maps connecting key structures like people, root questions, tasks, objects, & tools.
Tool: Kumu
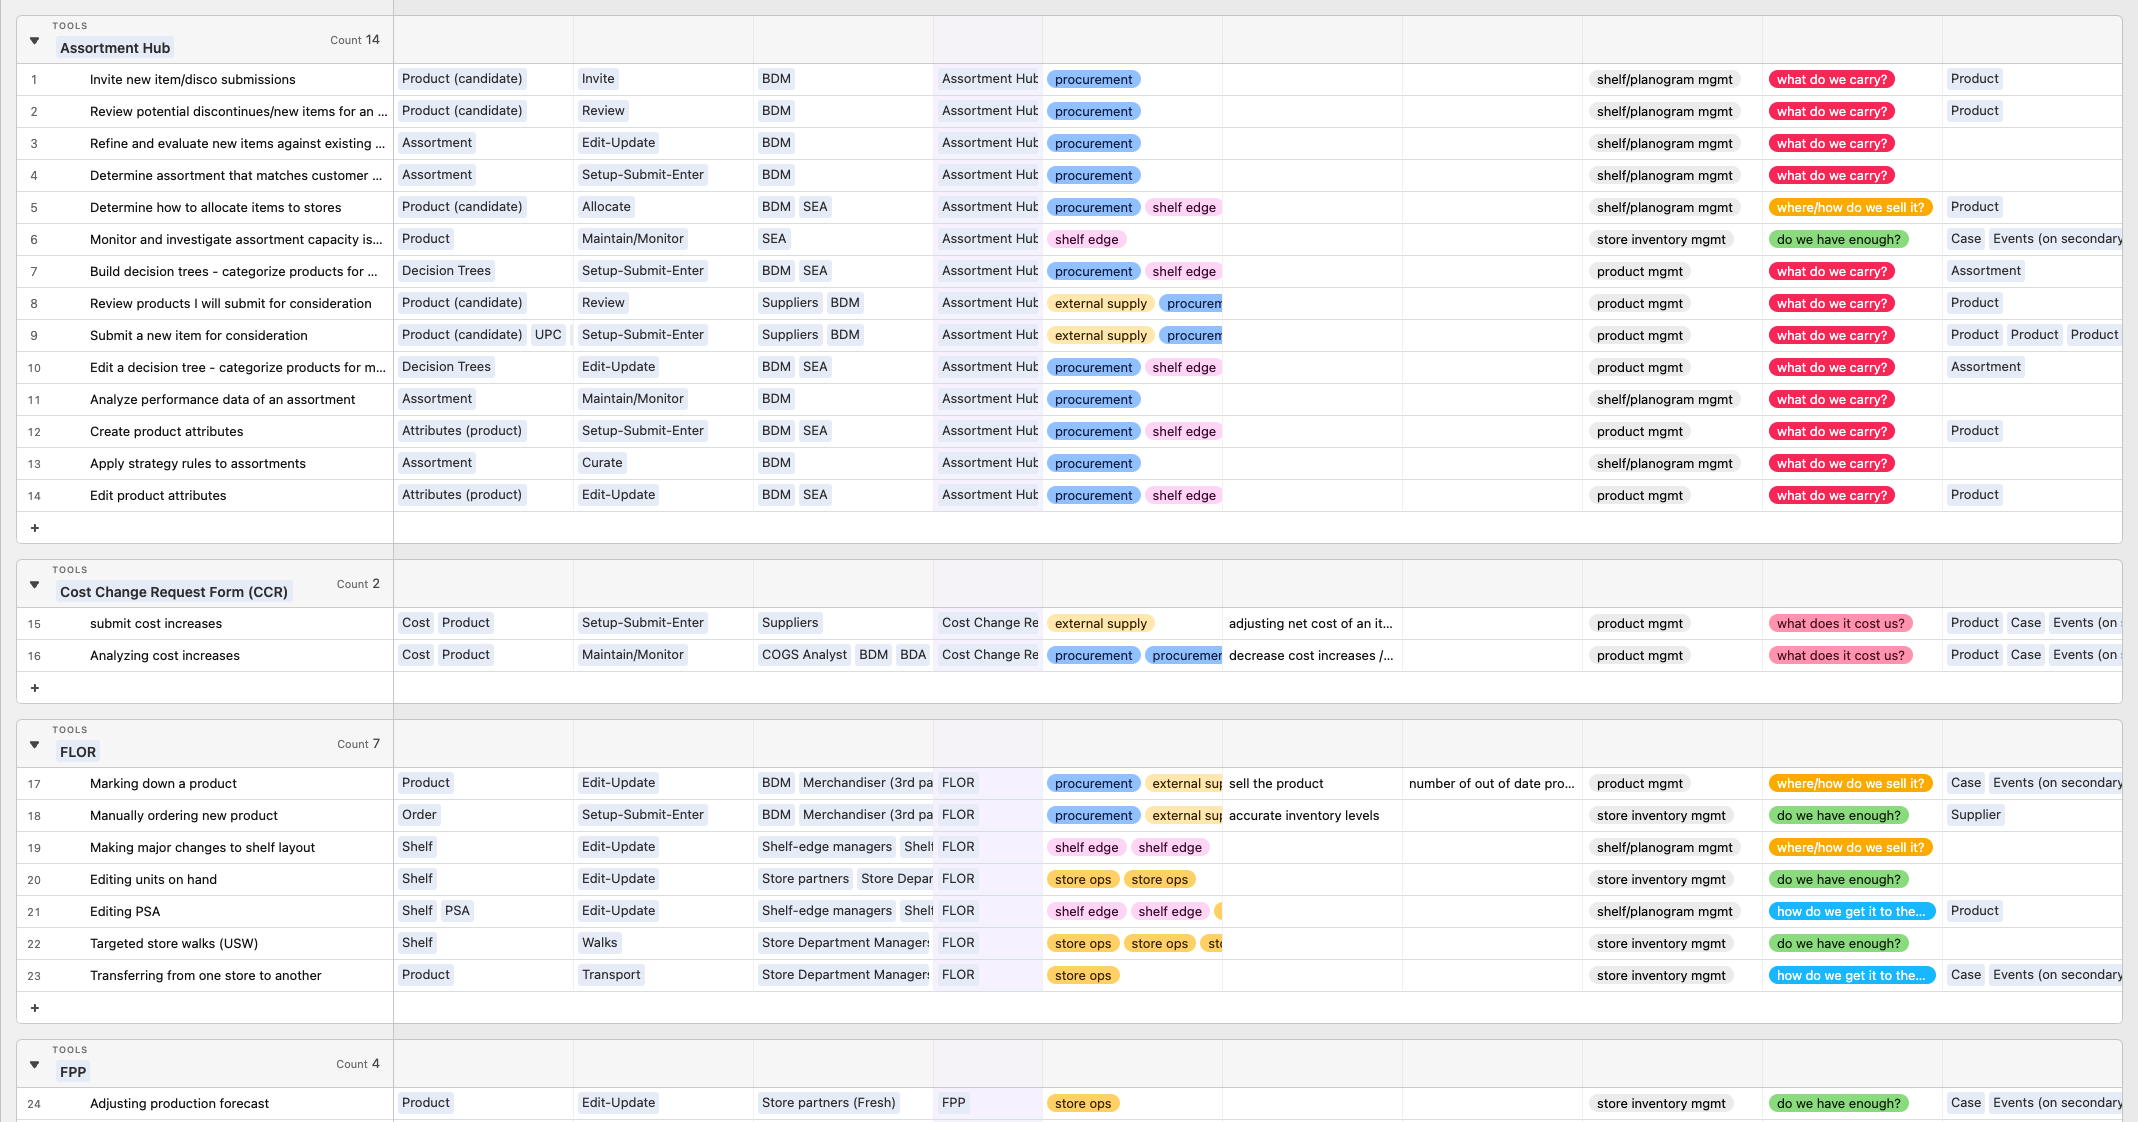
Task flow library
An easily accessible library of task flows created out of data gathered during our design team workshop.
Tool: Airtable
Research archive
An archive of prior foundational research designers can use before kicking off new projects. This resource expanded an existing repository our research team managed.
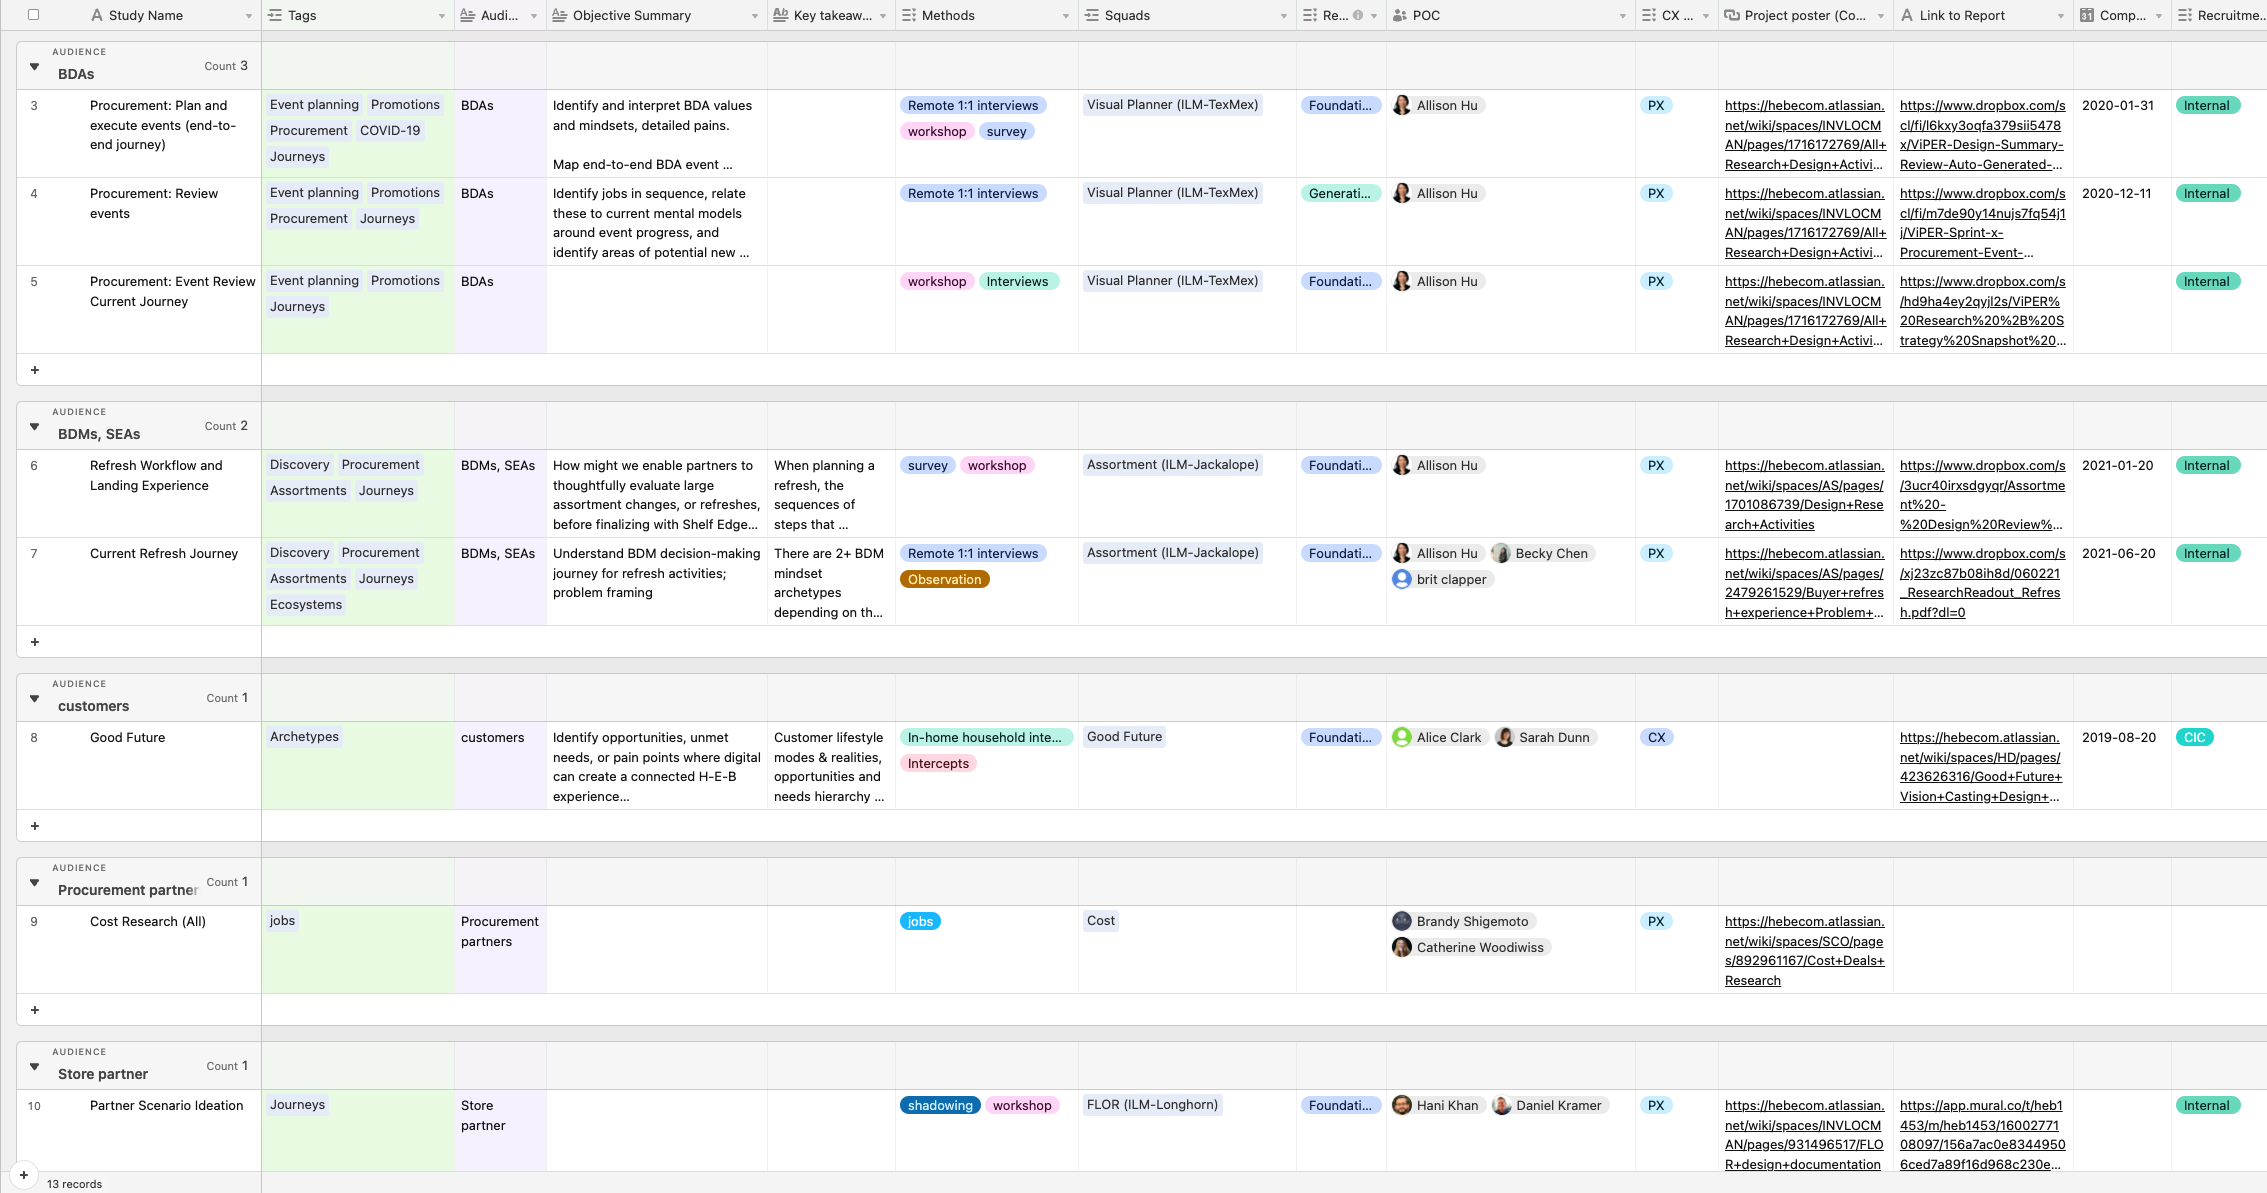
Tool: Airtable
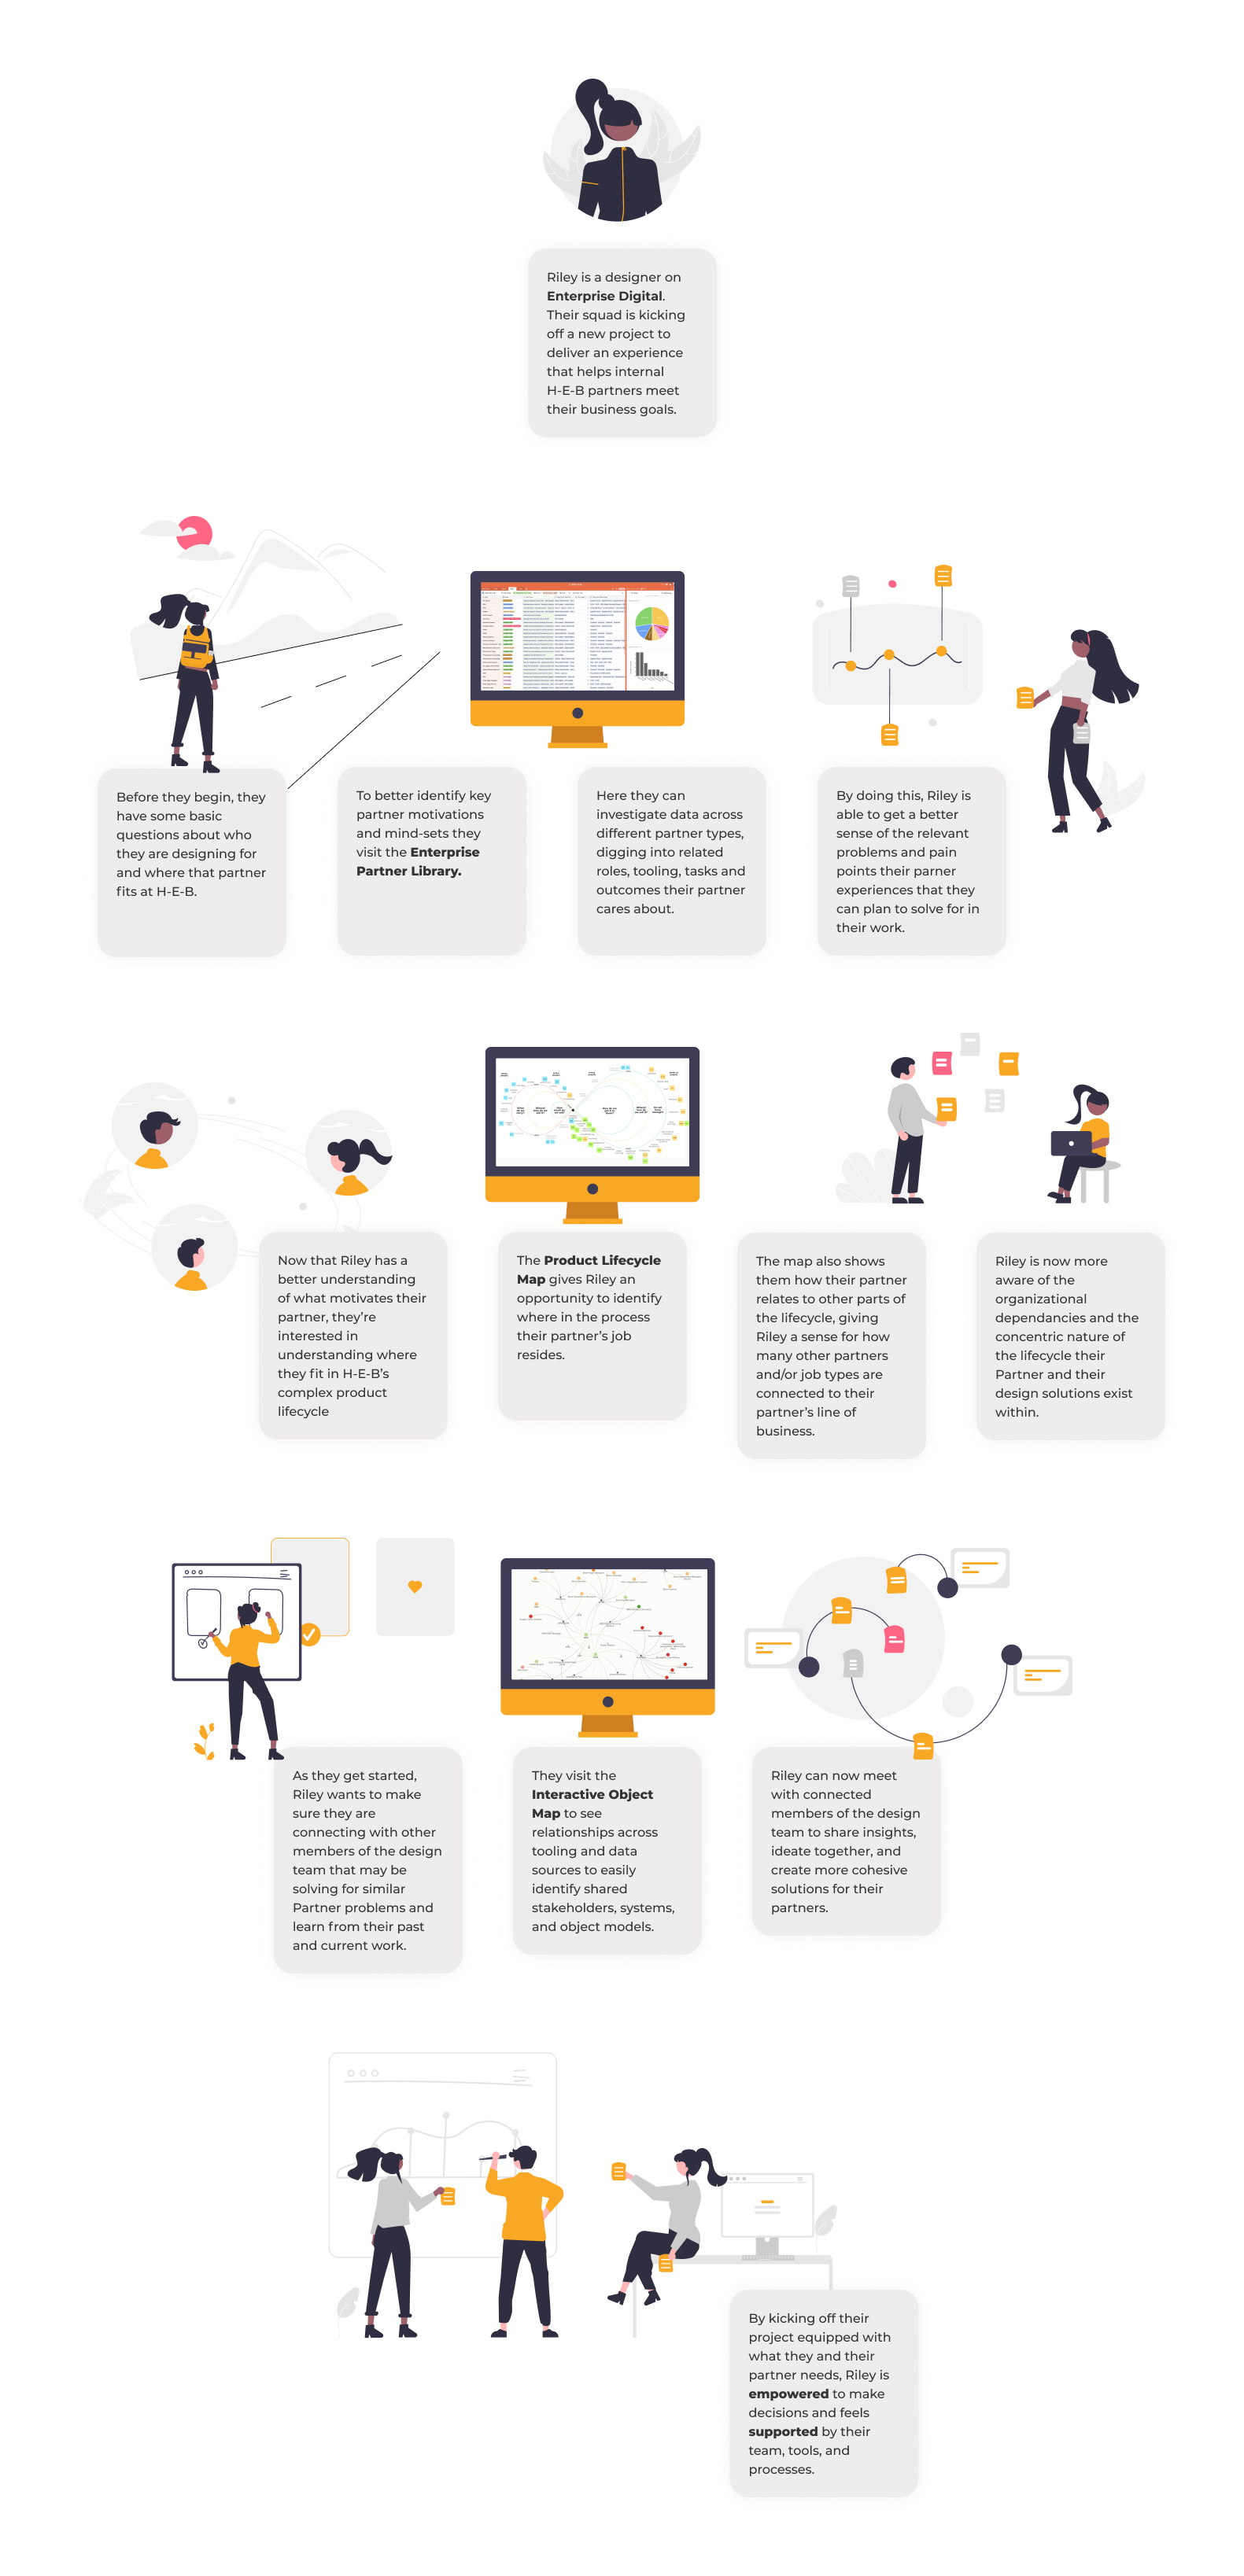
Designer journey map
A narrative journey showcasing how the toolkit could be used throughout a designer’s discovery and design definition process. The purpose was to help convey the usefulness of the toolkit in a high-level way, showcasing its value across a variety of projects and audiences.